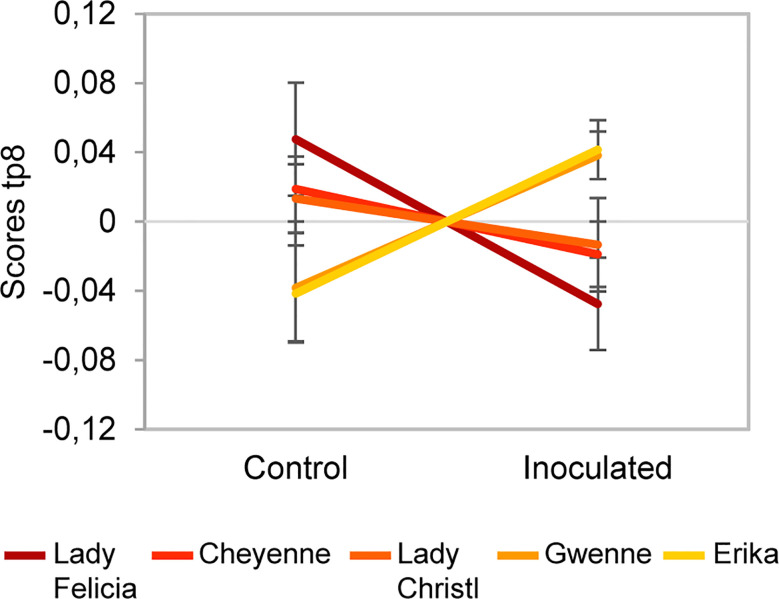
Figure 9.
Scores of predictive component tp8 associated with the Cultivar x Inoculation interaction effect for the negative ion mode dataset. The score value is reported on the vertical axis for control and inoculated conditions (in the horizontal axis). A difference between resistant cultivars (Erika and Gwenne) and susceptible cultivars (Lady Felicia, Cheyenne, and Lady Christl) can be observed.

