Figure 1.
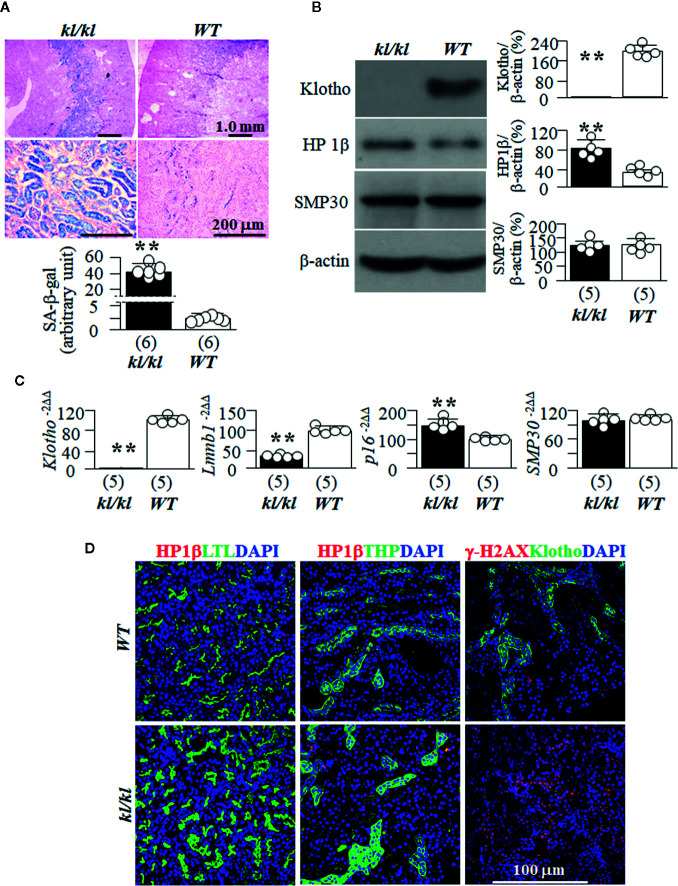
WT and kl/kl mice were given normal Pi diet and sacrificed at 6 weeks old. Each genotype had 6 mice. (A) SA-β-gal stain for the evaluation of cellular senescence; and Eosin counterstain in the kidneys of kl/kl and WT mice. Upper panel: representative images of SA-β-gal stain in kidney sections; bottom panel: quantitative score of SA-β-gal stain in kidney sections. (B) Immunoblots of total kidney lysates for Klotho and senescence markers. Left panel: representative blots for HP1β, SMP30 and β-actin (loading control) in total kidney lysates. Right panel: Summary of all immunoblots from each group. (C) Quantitative analysis of transcripts of Klotho and cellular senescence markers (Lmnb1, p16, and SMP30) in the kidneys. Sample number in each group is in brackets underneath each corresponding bar. Data are presented as mean ± S.D. with scatter plots of individual data points. **P<0.01 between two genotypes by un-paired Student t test for (A–C). (D) Co-immunostaining for senescence markers (HP1β and γ-H2AX) (red color) with LTL (marker for PT, green), THP (marker for TAL, green), Klotho (marker for DT, green), and DAPI for nuclear stain (blue).

