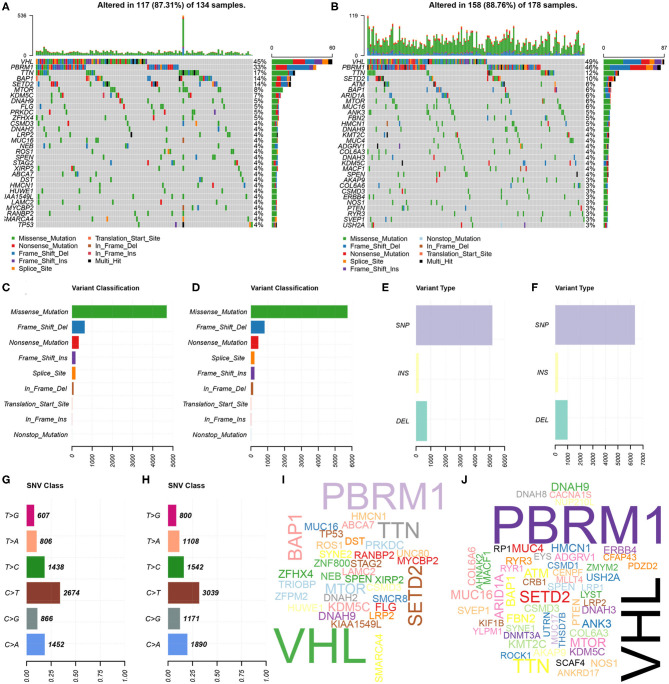
Figure 5.
Landscape of mutation profiles between high- and low-risk KIRP patients. (A,B) Waterfall plots represent mutation information in each sample of the high- and the low-risk group KIRP patients. The diverse colors with annotations at the bottom represent the various mutation types. (C,D) The variant classification in high- and the low-risk group KIRP patients. (E,F) The type of genetic alterations in high- and the low-risk group KIRP patients. (G,H) The SNV class in high- and the low-risk group KIRP patients. (I,J) The gene cloud plot showed the mutated frequencies in high- and the low-risk group KIRP patients. The larger the gene, the higher the mutation frequency.

