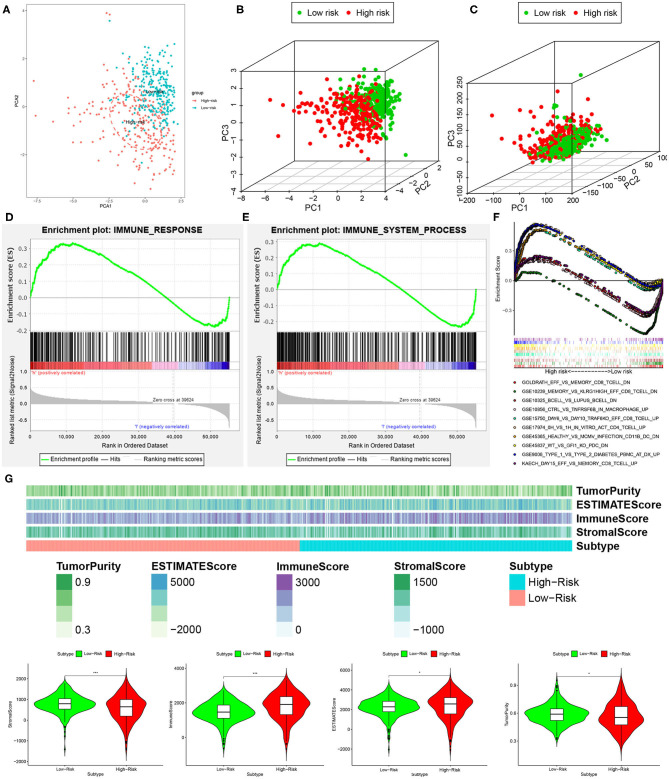
Figure 7.
High- and low-risk groups showed different immune status. (A,B) Principal component analysis for immune-related lncRNAs sets between the high- and low-risk groups, showing a remarkable difference between two patterns. (C) Principal component analysis for genome-wide expression profiles between high- and low-risk groups, no significant separation in the immune status between two patterns. GSEA analysis exhibited that both IMMUNE_RESPONSE (D) and IMMUNE_SYSTEM_PROCESS (E) were enriched in the high- compared with low-risk group. (F) The five most significant gene sets in C7 collection sets (IMMUNOLOGIC_SIGNATURE) between two groups. (G) The high-risk group had a lower stromal score and tumor purity but higher immune score and Estimate score compared with the low-risk group. *P < 0.05 and ***P < 0.001.

