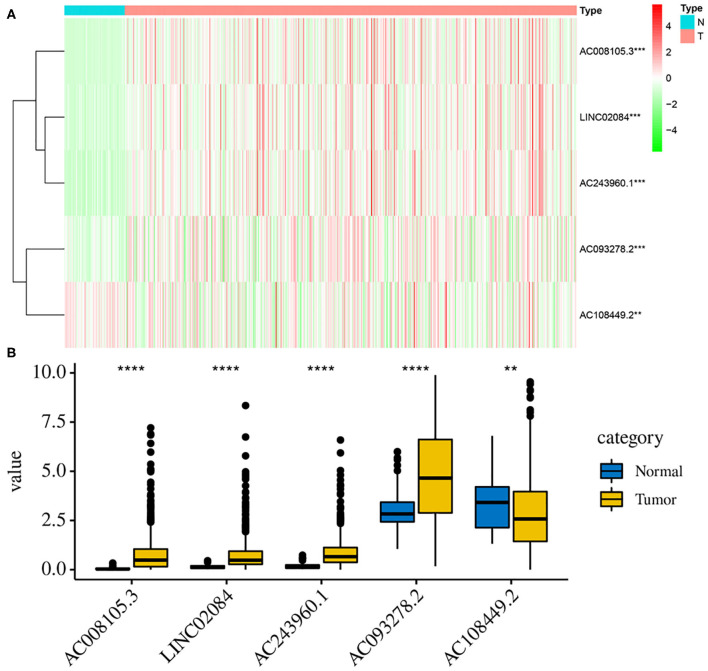
Figure 8.
Validation the expression levels of those 5 lncRNAs between tumor and normal samples. The heat map (A) and bar graph (B) showed the expression levels of 5 lncRNAs between 539 KIRC tumor tissues and 72 non-tumor tissues in the TCGA data set. The mean expression levels of AC008105.3, LINC02084, AC243960.1, and AC093278.2 in KIRC samples were significantly lower while AC108449.2 was significantly higher than that in non-tumor tissues. **P < 0.01, ***P < 0.001, and ****P < 0.0001.

