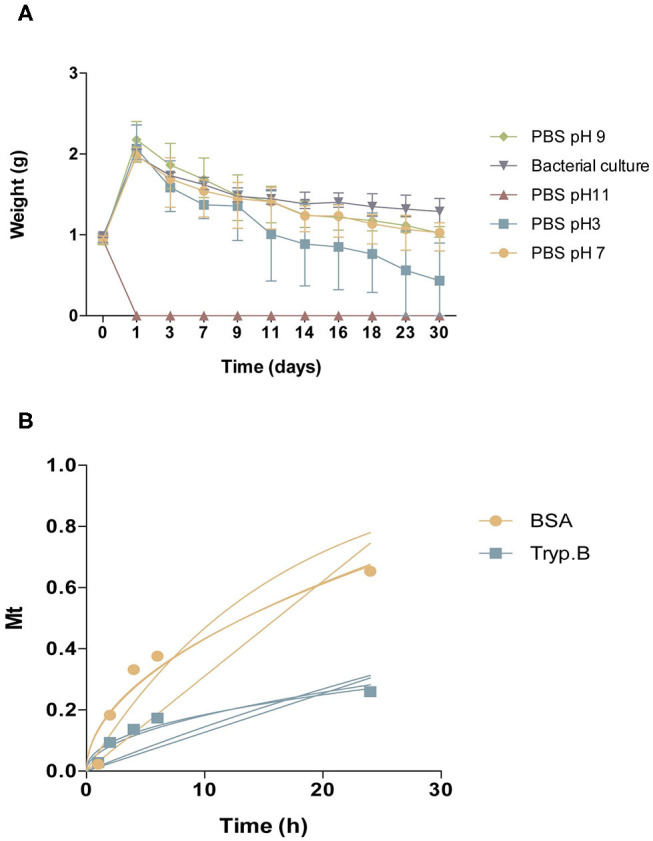
Figure 2.

Characterization of CoverGel. (A) Degradation of the hydrogel when placed for 30 days under different conditions ( PBS pH3,
  PBS pH7,
  PBS pH9,
  PBS pH 11, and
  bacterial culture). Graph represents weight of hydrogel over days. (B) Drug-release kinetics for
  Bovine serum albumin and
  Trypan blue. Graph represents concentration of substance on release medium (Mt) over time. Lines represent the different mathematical models tested.
