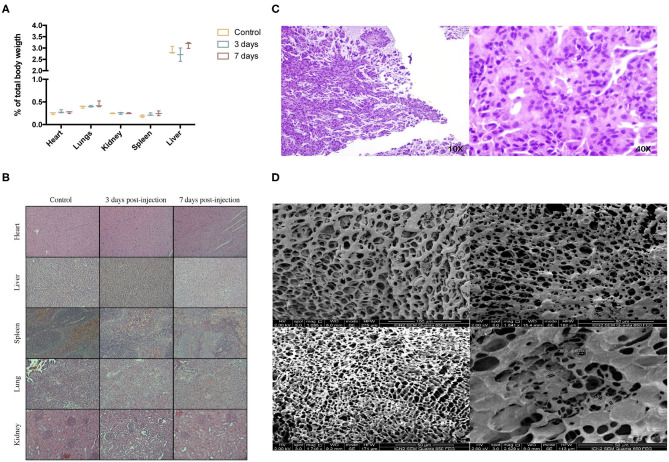
Figure 4.
In vivo biocompatibility study. (A) % of organ weight relative to total body weight after intraperitoneal injection of 10 mL/kg of CoverGel on rats.  represents control rats
  rats euthanized 3 days post injection and
  rats euthanized 7 days post injection. (B) Representative images of major organs H/E stainings from each group at a 40 × zoom. (C) H/E staining images of tissue surrounding subcutaneously placed CoverGel after 10 days post placement (10 × left image, 40 × right image). (D) Scanning electron microscopy images of hydrogel after 10 days post subcutaneous placement.

