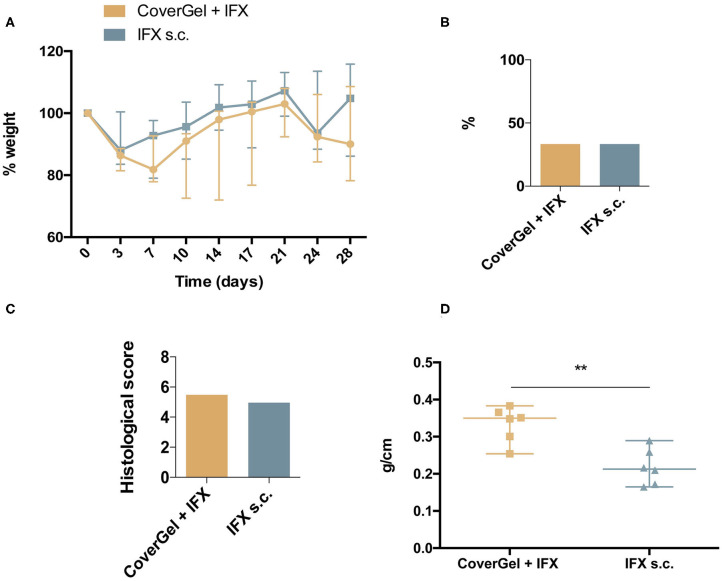
Figure 8.
Clinical evaluations on rats from the acute EC animal model. Color representations are as follow:  CoverGel + IFX group and
  IFX s.c. group. (A) Variation (Δ) of weight relative to day 0 (day of induction). (B) Bacterial translocation to the liver. (C) Histological score. (D) Colon weight/length ratio. **p < 0.01.

