An official website of the United States government
Here's how you know
Official websites use .gov
A
.gov website belongs to an official
government organization in the United States.
Secure .gov websites use HTTPS
A lock (
) or https:// means you've safely
connected to the .gov website. Share sensitive
information only on official, secure websites.

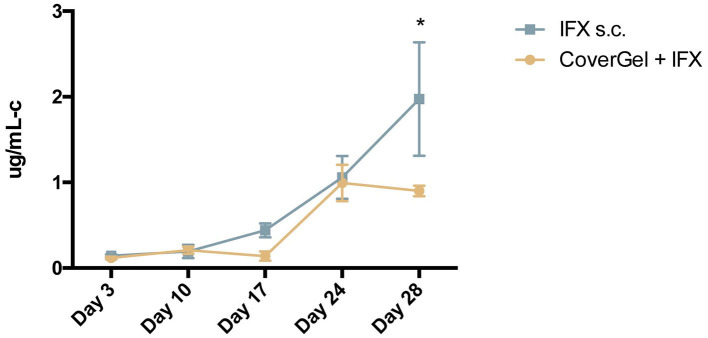
 CoverGel + IFX group and
  IFX s.c. group. Graph represents the concentration of ATIs (μg/mL-c calibrated in comparison to a polyclonal rabbit α-IgG standard). *p < 0.05.