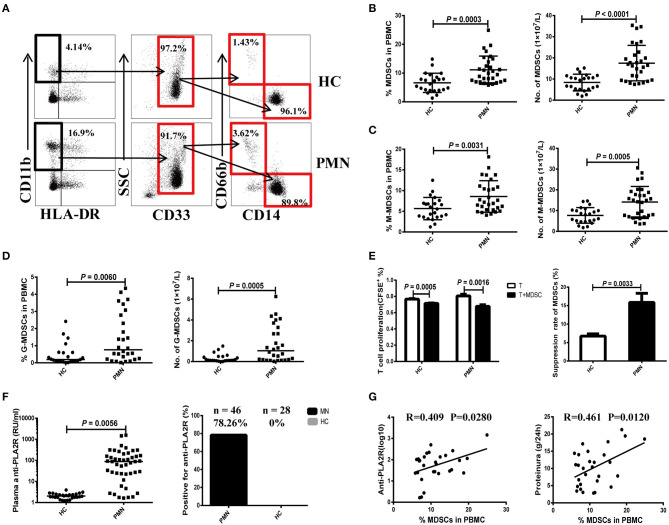
Figure 1.
Expansion of MDSCs in PBMCs is correlated with the disease activity in PMN patients. (A) Staining profiles of MDSCs (CD11b+CD33+HLA-DR−), M-MDSCs (CD11b+CD33+HLA-DR−CD14+CD66b−), and G-MDSCs (CD11b+CD33+HLA-DR−CD14−CD66b+) from representative HC and PMN patients. (B–D) Percentage (left panel) and number (right panel) of MDSCs (P = 0.0003, t-test; P < 0.0001, t-test, respectively) (B), M-MDSCs (P = 0.0031, t-test; P = 0.0005, t-test, respectively) (C), and G-MDSCs (P = 0.0060, Mann-Whitney U-test; P = 0.0005, Mann-Whitney U-test, respectively) (D) in HCs (n = 23) and PMN patients (n = 29). (E) In vitro suppression assay (left panel) revealed that MDSCs from PMN patients have a stronger ability to suppress autologous naïve CD4+T cells (anti-CD3/CD28–induced polyclonal T cells) proliferation than those from HCs. T-cell proliferation inhibition rates (right panel) of MDSCs from HC and PMN patients were 6.7 and 15.9%, respectively (P = 0.0033, t-test). (F) Content (P = 0.0056, t-test; left panel) and positive percentage (right panel) of plasma anti-PLA2R antibody from PMN patients (78.26%, n = 46) and HCs (0%, n = 28). (G) Correlation analysis between MDSC frequency and anti-PLA2R level (P = 0.028, Pearson correlation; left panel) or 24-h urine protein quantification (P = 0.012, Pearson correlation; right panel) from PMN patients. Anti-PLA2R is displayed with log10. The data are shown as mean ± standard deviation (SD) or median (25%, 75%). Between-group comparisons were performed using a two-tailed t-test for normally distributed data, or a Mann-Whitney U-test for non-normally distribution data.

