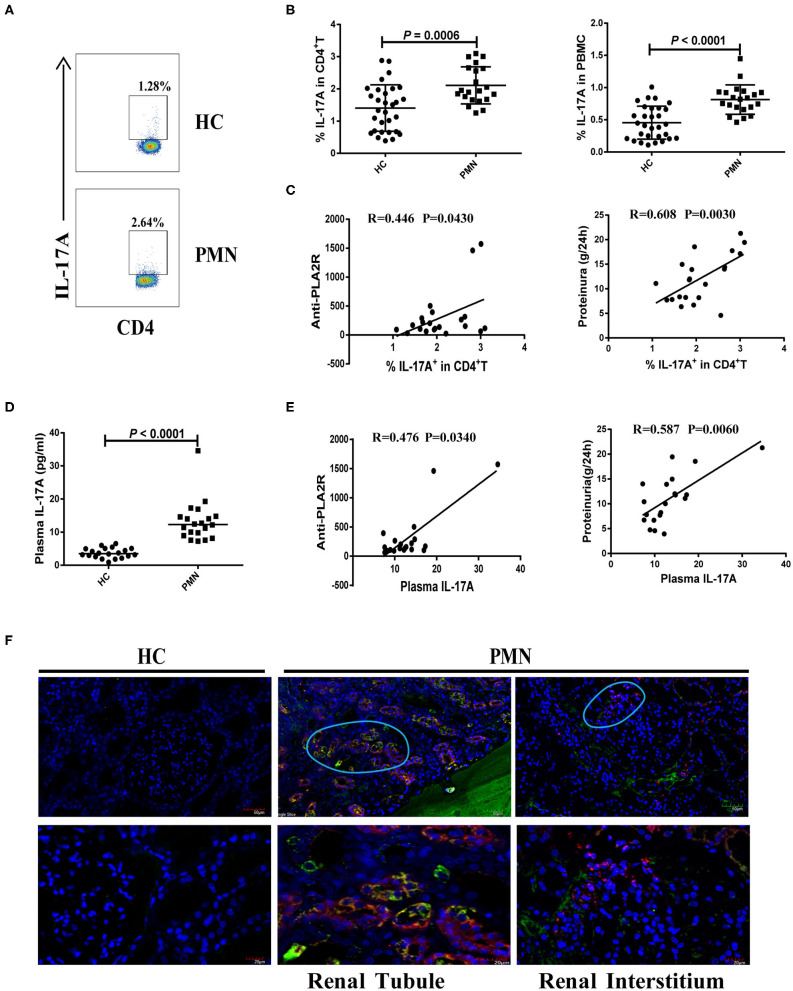
Figure 3.
Increased number of Th17 cells and plasma level of Th17 cytokines in PMN patients. Frequency of IL-17+CD4+ cells in HCs and PMN patients determined using flow cytometry following a brief stimulation with leukocyte activation cocktail. (A) Staining profile of IL-17A from the peripheral blood of HCs and PMN patients. (B) Percentage of IL-17A (1.406 ± 0.722% vs. 2.107 ± 0.577%; 0.455 ± 0.256% vs. 0.814 ± 0.228%) in CD4+T (left panel) and PBMCs (right panel) from peripheral blood of HCs and PMN patients. (C) Correlation analysis between IL-17+CD4+ T cell frequency and anti-PLA2R levels (P = 0.0430, Spearman correlation; left panel) or 24-h proteinuria quantification (P = 0.0030, Spearman correlation; right panel). (D) Plasma IL-17A content from HCs and PMN patients (P < 0.0001, Mann-Whitney U-test; 3.525 [(2.640, 5.045) vs. 12.317 (9.159, 14.735)]. Data are shown as mean ± SD or median (25%, 75%). (E) Positive correlation between plasma IL-17A and anti-PLA2R levels from PMN patients (P = 0.0340, Spearman correlation; left panel) or 24-h proteinuria quantification (P = 0.0060, Spearman correlation; right panel). (F) Immunofluorescent staining of IL-17 and CD11b in kidney tissue sections from two patients with minimal change disease and a healthy subject used as a control (n = 3) and PMN patients (n = 3) using anti-human CD11b (red)/IL-17 (green) antibody and DAPI (blue). IL-17+ cells were adjacent to CD11b+ cells and were primarily detected in the renal tubules (PMN-left panel) and interstitial areas (PMN-right panel) of PMN patients. Representative images are shown. Scale bars represent 50 μm (top) and 20 μm (bottom), respectively.

