Figure 6.
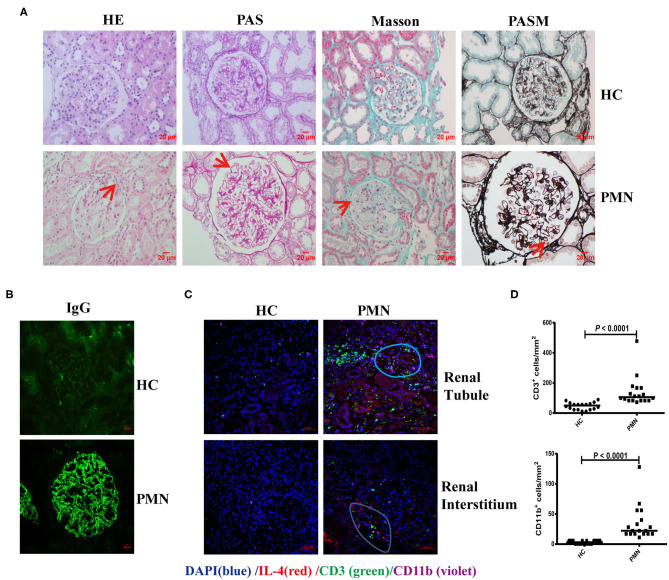
CD3+ T cells were adjacent to CD11b+ cells in PMN patients. Histological analysis of renal biopsy samples from PMN patients (n = 3). Renal biopsy samples from two patients with minimal change disease and a healthy subject were used as controls (n = 3). (A) Pathological features of the kidney tissues from PMN patients shown using light microscopy (LM). Focal inflammatory cell infiltration outside the arteriolar capsule (arrow) in the H&E-stained section, mesangial proliferation in the glomerulus (arrow) identified by PAS staining, immune complex deposition and “spikes” displayed in the basal membrane by Masson and PASM are shown. Representative images are shown. Original magnification, ×400. (B) Immunofluorescence (IF) staining of IgG in kidney tissue sections from HCs and PMN patients. Original magnification, ×400. (C) The kidney tissues from PMN patients were analysed by multiplex IHC assays using anti-human IL-4 (red)/CD3 (green)/CD11b (violet) antibody and DAPI (blue). The result shows that IL-4 is diffusely expressed in the kidney tissue. Representative staining images of kidney tissues from PMN patients are shown. Scale bars represent 50 μm. (D) The densities (per mm2) of CD3+ and CD11b+ cells in HCs and PMN patients, and the randomly selected areas of the kidney tissues from HCs and PMN patients. Each symbol represents the density of positively stained cells in each individual microscopic area (six areas were counted for each kidney sample, and data were analysed using the Mann-Whitney U-test).

