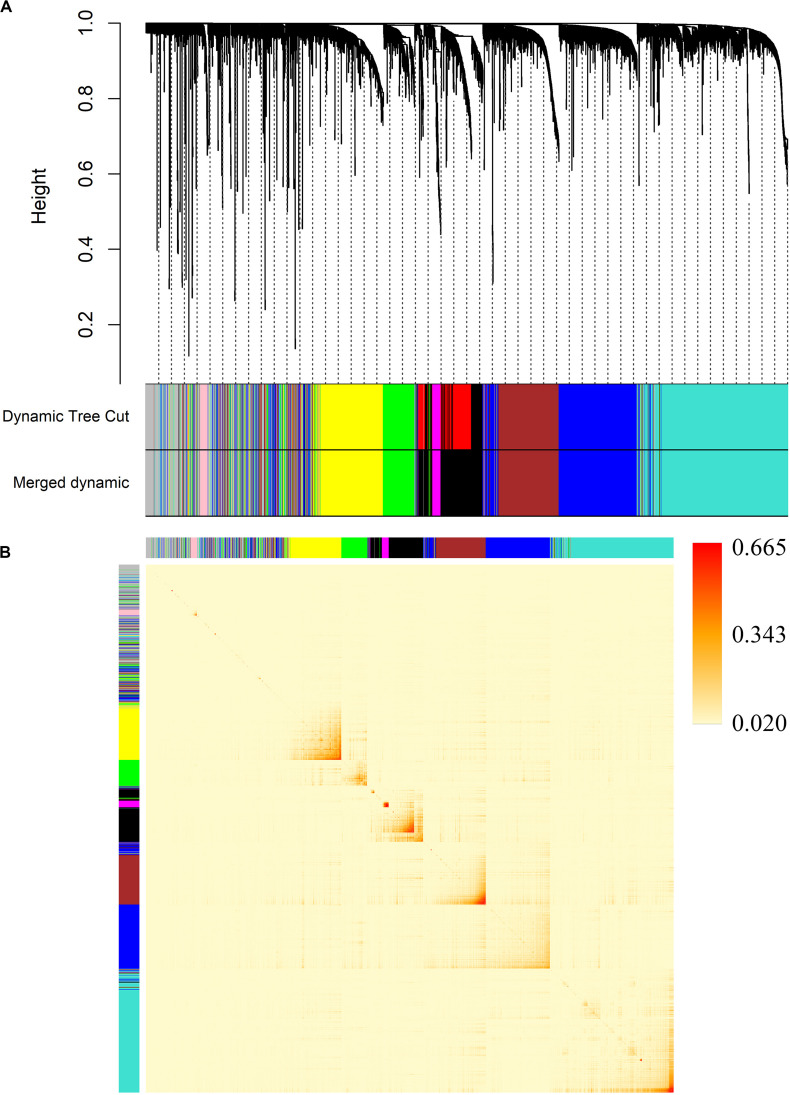
FIGURE 4.
Division of co-expression gene modules and an adjacency heatmap of genes. (A) Dendrogram of all 5,580 genes clustered by average linkage hierarchical clustering based on the TOM-based dissimilarity measure. (B) The adjacency heatmap of 5,580 genes. The color intensity represents the weighted correlation coefficients between pairwise genes.

