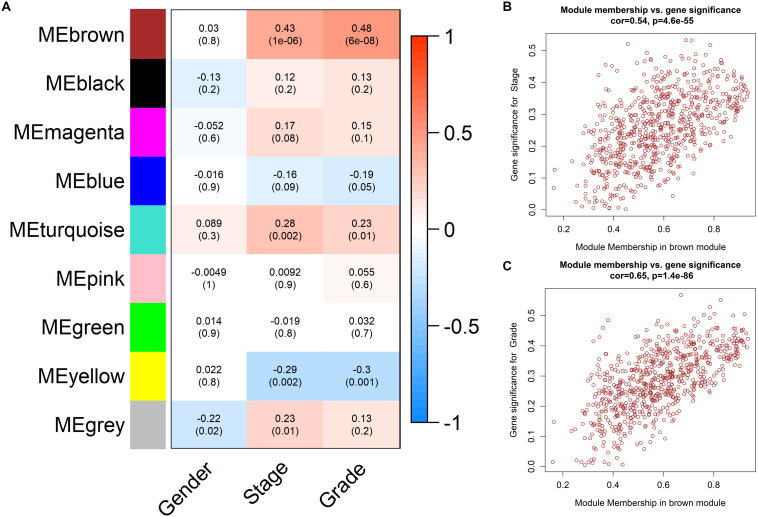
FIGURE 5.
Determination of the ccRCC-related module. (A) Heatmap of trait-module correlations. The color of each cell reflects the correlation coefficients (red for positive correlation and blue for negative correlation). The statistical significances of correlation relationships were noted in the cells. The brown module was thus identified as a ccRCC-related module. (B) Scatter plot displaying correlation between Gene significance (GS) and Module Membership (MM) of pathological stage of genes in the brown module. (C) Scatter plot displaying correlation between Gene significance (GS) and Module Membership (MM) of tumor grade of genes in the brown module.

