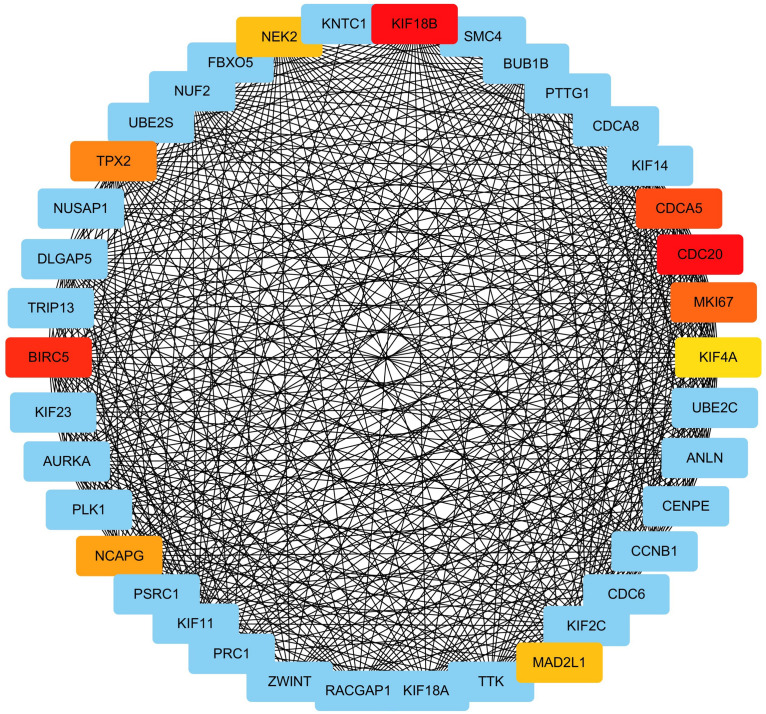
FIGURE 7.
Identification of hub gene by MCC method. The MCC values of genes in the GO term “mitotic nuclear division” were calculated. Genes with top 10 MCC values were colored with red and yellow color and other genes was colored with blue. Among genes with top-10 MCC values, red means relative bigger MCC value and yellow means relative smaller MCC values, and the same color means the same MCC values.

