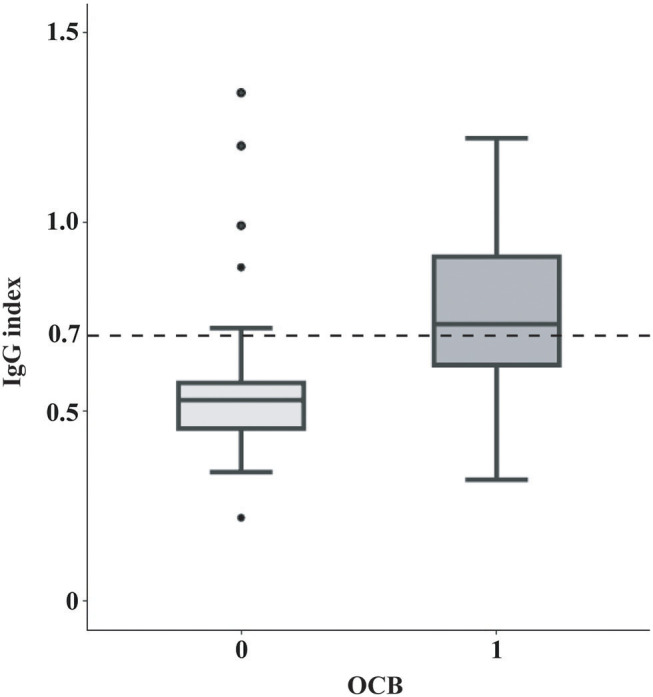
Figure 1.

Correlation between OCB positivity and IgG index. In box-and-whisker plots the central horizontal bar shows the median IgG index, and the lower and upper boundaries show the 25th and 75th percentiles, respectively. The dashed horizontal line represents an IgG index of 0.7. IgG index positivity (IgG index > 0.7, the cut-off in our center and also the often-used cut-off in many other centers) was highly associated with the OCB status (Chi-square test, X2 = 22.90, P < 0.001). IgG, Immunoglobulin G; OCB, oligoclonal band.
