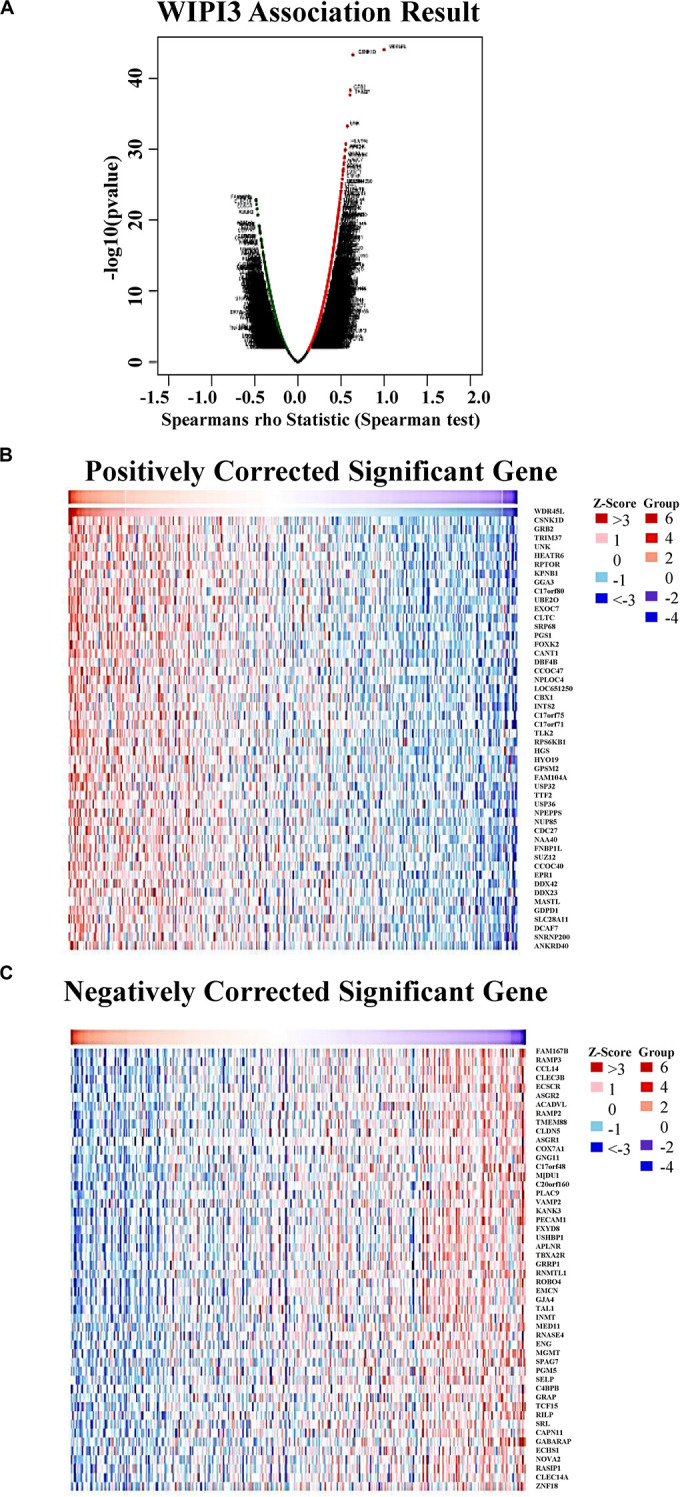
FIGURE 3.

Genes differentially expressed in correlation with WIPI3 in hepatocellular carcinoma (LinkedOmics). (A) Spearman test was used to analyze correlations between WIPI3 and genes differentially expressed in LIHC. (B,C) Heat maps show the top 50 significant genes positively and negatively correlated with WIPI3 in LIHC. Red indicates positively correlated genes, and green indicates negatively correlated genes.
