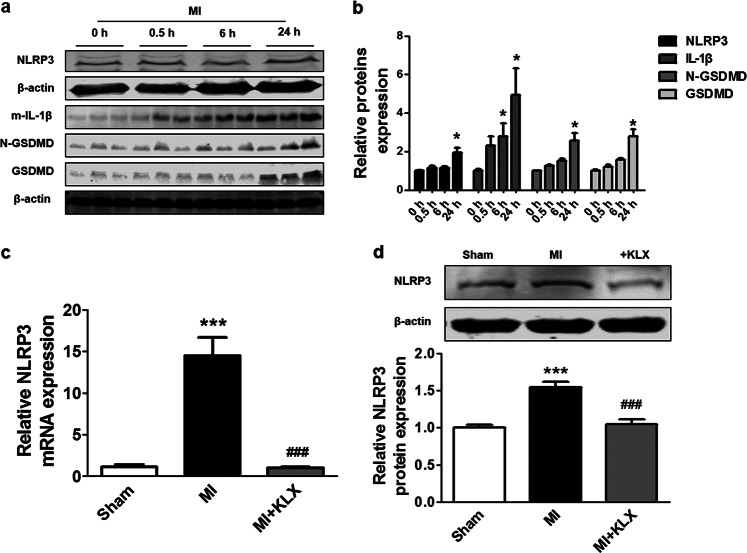
Fig. 3.
Effects of KLX on the NLRP3 inflammasome in MI mice. a, b Western blot analysis of the protein levels of NLRP3 (n = 5), mature IL-1β (n = 5), GSDMD (n = 4), and N-GSDMD (n = 4) at varying time points after MI. The 0 h time point indicates the sham operation group. c Quantitation of NLRP3 mRNA level 24 h after MI upon treatment with KLX-H, as determined by qRT-PCR; n = 5. d Western blot analysis of NLRP3 protein level 24 h after MI upon treatment with KLX-H; n = 6. The data are presented as the mean ± SEM. *P < 0.05, ***P < 0.001 vs. sham, ###P < 0.001 vs. MI. b, Two-tailed unpaired Student’s t test. d One-way ANOVA followed by Tukey’s post hoc analysis

