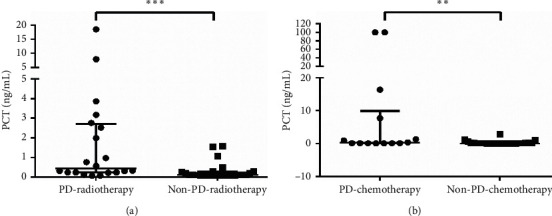
Figure 4.

Correlation between PCT level and clinical response in bacteria-infected subgroup B. (a) PCT level expressed higher in PD-radiotherapy (response to radiotherapy was PD) (n = 20) than that in non-PD-radiotherapy (response to radiotherapy was SD and PR) (n = 25) of bacteria-infected subgroup B. (b) For patients treated with chemotherapy, PCT level of patients with PD (PD-chemotherapy) (n = 14) was higher than non-PD-chemotherapy (response to chemotherapy was SD and PR) (n = 24) patients in bacteria-infected subgroup B. Statistical significance was calculated with Mann–Whitney test. ∗∗p < 0.01; ∗∗∗p < 0.001; PCT: procalcitonin; PR: partial response; SD: stable disease; PD: progressive disease.
