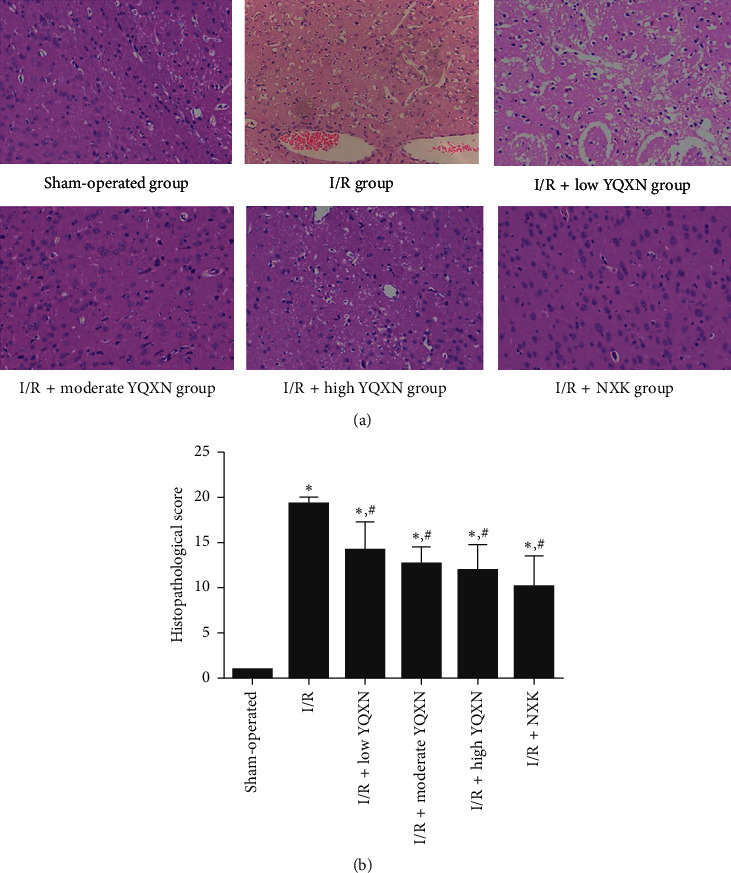
Figure 2.

Histopathological change of the brain injured tissue in I/R rats with different treatments. (a) Images of HE staining. (b) Histopathological scores of rats in different groups. ∗P < 0.05, compared with the sham-operated group; #P < 0.05, compared with the I/R group.
