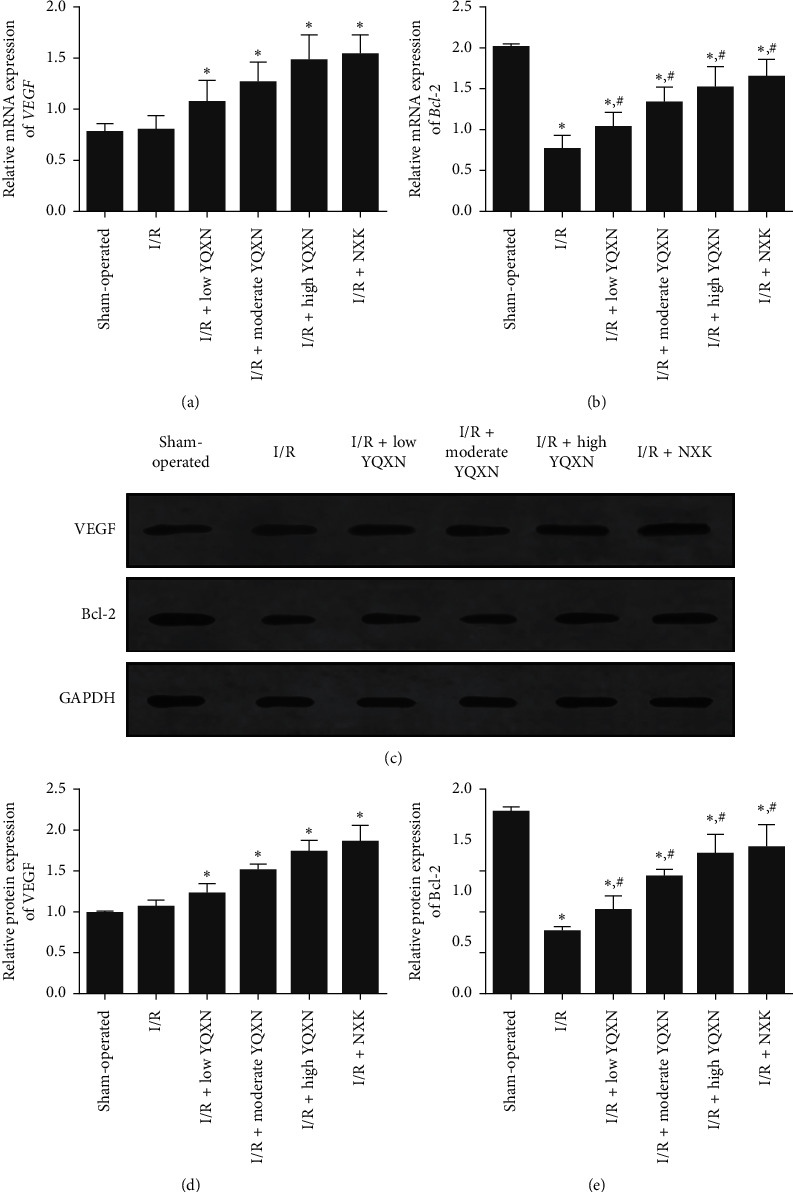
Figure 5.

The expression levels of VEGF and Bcl-2 in brain tissues of different groups. (a) The relative mRNA expression level of VEGF determined by real-time quantitative PCR (RT-qPCR). (b) The relative mRNA expression level of Bcl-2 determined by RT-qPCR. (c) The protein expression levels of VEGF and Bcl-2 determined by western blot. (d) The grey analysis of VEGF protein. (e) The grey analysis of Bcl-2 protein. ∗P < 0.05, compared with the sham-operated group; #P < 0.05, compared with the I/R group.
