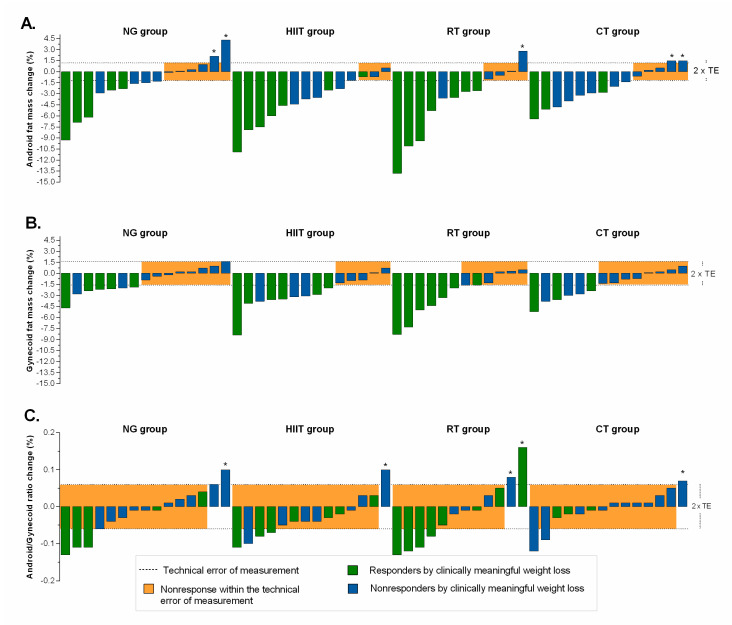
Figure 4.
Individual change by intervention group based on distribution fatness indexes. (Panel A): android fat mass; (Panel B): gynecoid fat mass; and (Panel C): android/gynecoid ratio fat mass. The TE for each measurement (see “Methods” section for 2 × TE calculation) is illustrated by the lighter shaded area. Dashed lines represent the TE, while an individual falling within the shaded area would have demonstrated a nonresponse for both variables. Responders by clinically meaningful weight loss (≥5%) is illustrated by the green bar. Individual changes in blue bar represent nonresponse by clinically criterion weight loss (< 5%). *Adverse responders (individuals whose fat mass indexes increased by more than 2 × TE). NG: nutritional guidance alone group; HIIT: high-intensity interval training group; RT: resistance training group; CT: combined training (HIIT + RT) group.

