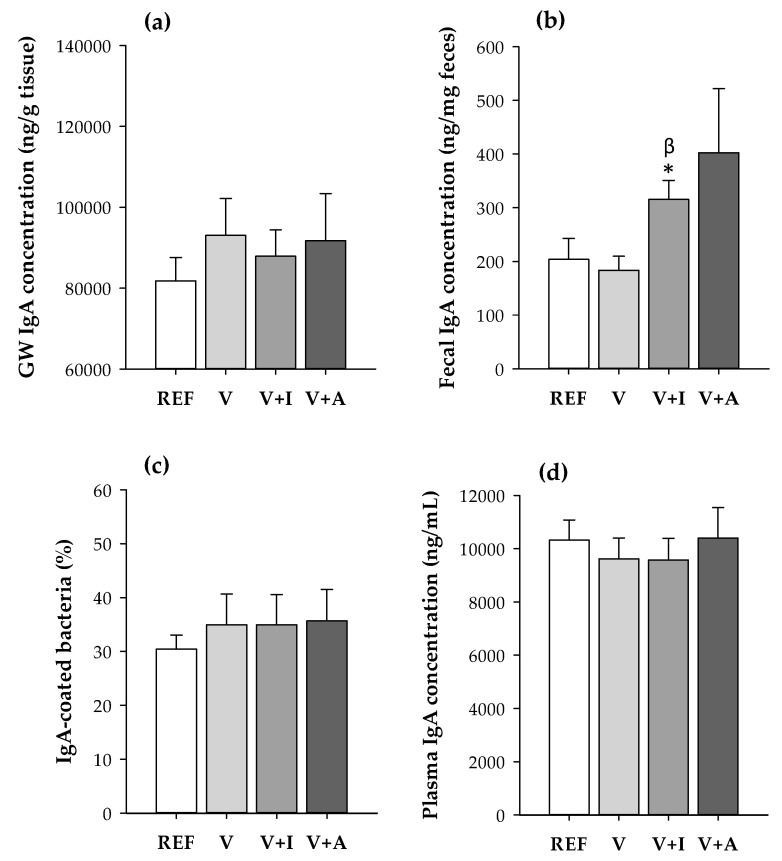
Figure 2.
(a) IgA concentration in gut wash (GW) and (b) fecal samples, (c) proportion of fecal IgA-coating bacteria and (d) plasma IgA concentration quantified at the end of the study for all experimental groups considering both sexes together. Results are expressed as mean ± SEM (n = 10/group). Statistical significance: * p < 0.05 vs. REF group; β p < 0.05 vs. V group.

