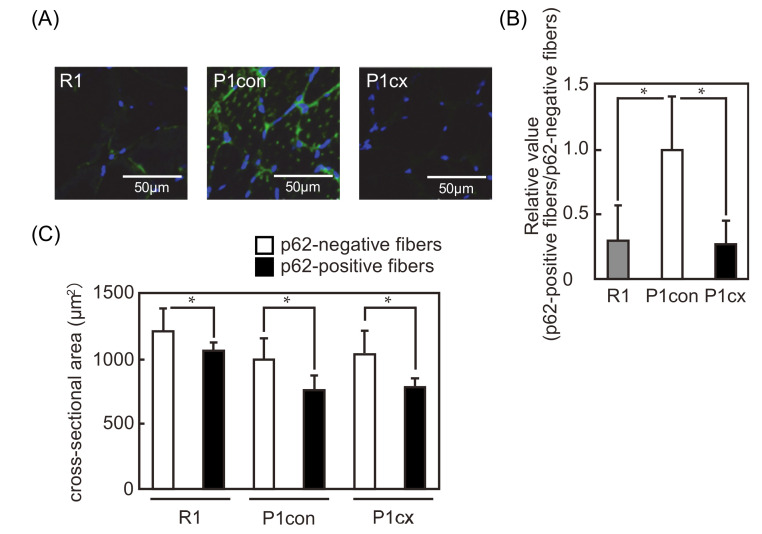
Figure 4.
p62-positive fibers in the soleus muscle of β-cryptoxanthin-administered SAMP1 mice. (A) Immunofluorescent staining of p62 in the soleus muscle of the SAMR1 (R1), SAMP1-control (P1con), and SAMP1-CX (P1cx) groups. Scale bar: 50 μm. (B) Relative value of the ratio of p62-positive fibers to p62-negative fibers in the SAMP1-control group. Values are represented as mean ± standard deviation. n = 5–8 per group. * p < 0.05, statistical significance compared with the SAMP1-control group. (C) CSA of p62-positive fibers (white bar) and p62-negative fibers (black bar). Values are represented as mean ± standard deviation. n = 6–8 per group. * p < 0.05, statistical significance compared with the CSA of p62-negative fibers.

