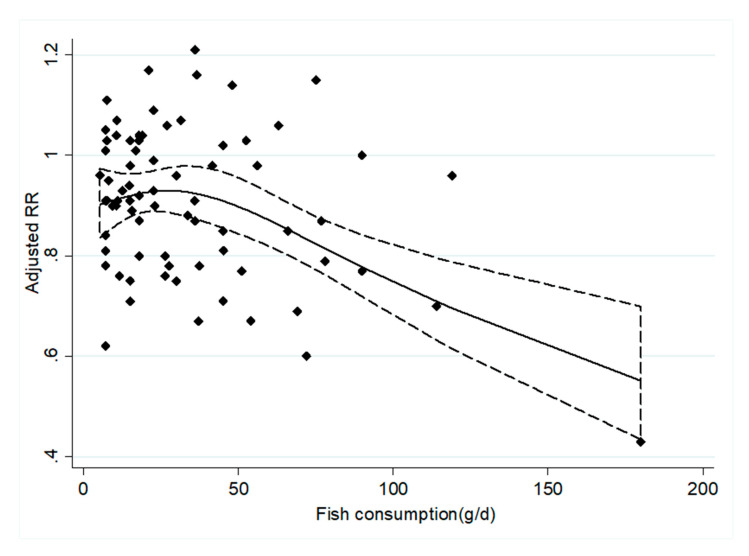
Figure 4.
The dose–response analysis between the fish consumption and the CHD incidence. The diamonds represented the adjusted RRs for each exposure quantile of fish consumption in the included individual studies. The solid line and the long dash line represent the estimated relative risk (RR) and its 95% confidence interval (CI). Abbreviations: g/d, grams per day.

