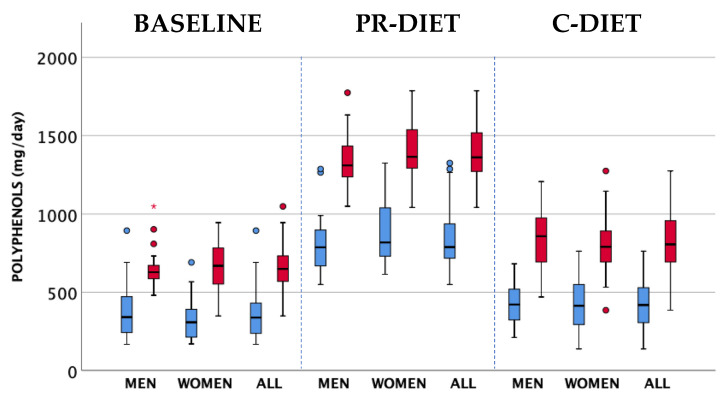
Figure 2.
Polyphenol intake at baseline and in polyphenol (PR)-diet and control (C)-diet in the whole group of subjects and stratified by gender. The intake has been estimated using the PE and USDA databases and other published data (TP in light blue) and by Folin–Ciocalteau data as reported in the PE database and other sources (TPC in red). Dots represent mild outliers that are more extreme than Q1 − 1.5 * IQR or Q3 + 1.5 * IQR but are not extreme data. Asterisks are extreme data that are more extreme than Q1 - 3 * IQR or Q3 + 3 * IQR (where Q1=quartile 1; Q3=quartile 3; IQR=interquartile range).

