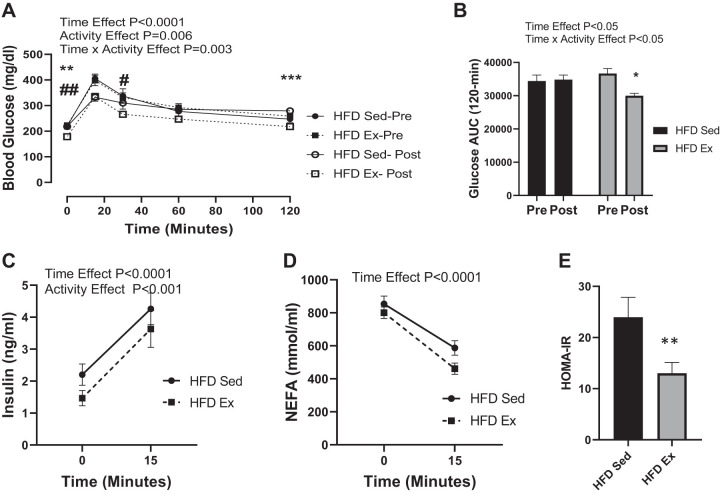
Fig. 2.
Blood glucose area under the curve (AUC) and insulin response are improved postexercise in high fat-fed mice. Mice were gavaged with glucose (2-[2H]-glucose and 6,6-[2H]-glucose; 2 g/kg lean body mass), and blood glucose was measured over 120 min with a handheld glucometer. Serum was collected at 0 and 15 min postgavage for measurement of insulin and nonesterified fatty acids (NEFA). Whole blood glucose glycemic excursion (A) and AUC (B) are shown for week 8 (Pre) and week 12 (Post). Serum insulin (C), NEFA (D), and homeostatic model analysis of insulin resistance (HOMA-IR; E) are provided for week 12 (Post). Time effect refers to difference between pre-and postexercise measurements. Activity effect refers to difference between Sed and Ex mice. Time × activity indicates an interaction. All data are expressed as means ± SE. *P < 0.01, **P < 0.001, ***P < 0.001, #P < 0.01, ##P < 0.001 represents within-group effects; n = 13/group.

