Fig. 3.
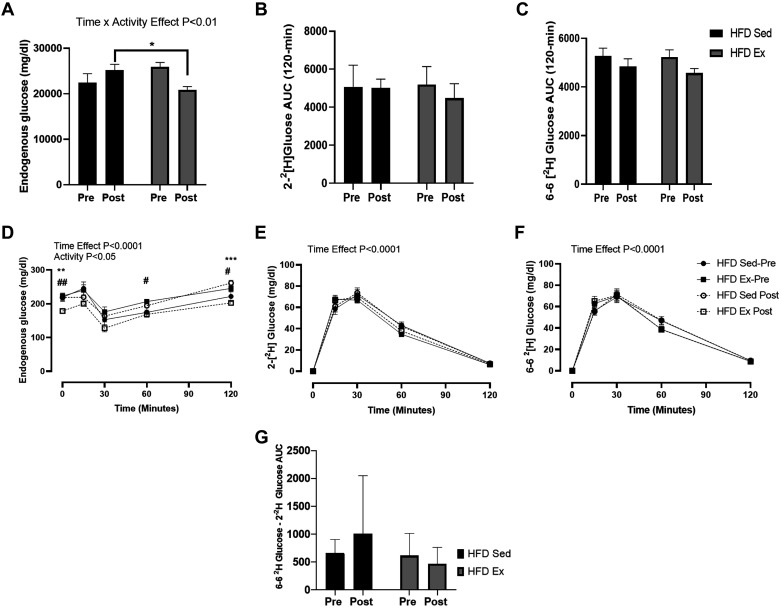
Dynamic glucose responses are altered in response to exercise. Serum after the glucose gavage (2-[2H]-glucose and 6,6 [2H]-glucose; 2 g/kg lean body mass) was collected, and glucose tracer concentration was determined. Tracerless glucose represents nonadministered endogenous glucose (A and D), 2-[2H] glucose (B and E), 6,6-[2H] glucose (C and F) concentrations, and hepatic futile cycle (G) were measured during the stable isotope-labeled oral glucose tolerance test (SI-OGTT) at Pre (week 8) and Post (week 12). Time effect refers to difference between pre- and post-measurements. Activity effect refers to the difference between Sed and Ex mice. Time × activity indicates an interaction. All data are expressed as means ± SE. *P < 0.01, **P < 0.001, ***P < 0.001, #P < 0.01, ##P < 0.001, within-group effect; n = 13/group.

