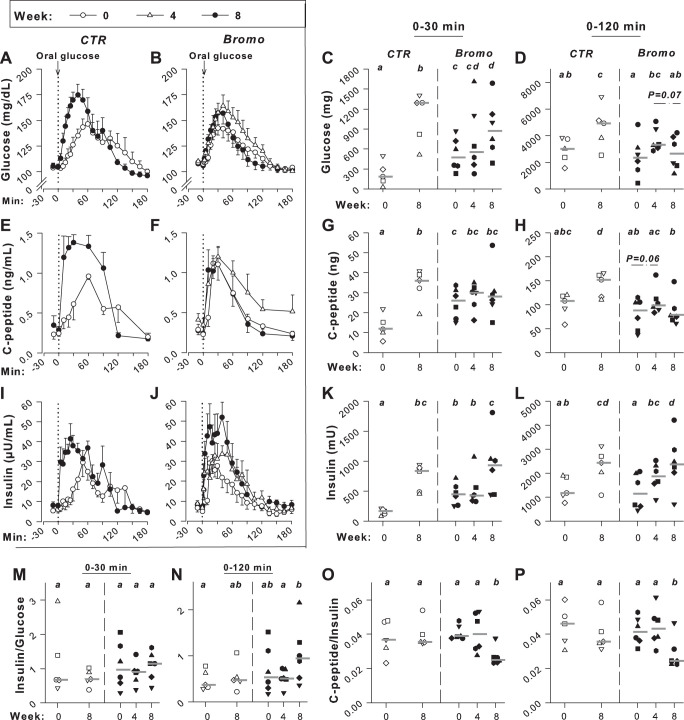
Fig. 1.
Oral glucose tolerance test data. Deep venous plasma glucose (A and B), C-peptide (E and F), and insulin (I and J) concentrations during consumption of the chow and meat diet (week 0; ○), after 4 wk of high-ft diet (HFD) but before bromocriptine treatment (week 4; Bromo group only; △), and after 3.5 wk of bromocriptine or placebo treatment (week 8; ●); data are means ± SE. Area under the curve changes from basal (ΔAUCs) during the first 30 and 120 min after glucose ingestion, respectively, are shown for the glucose response in C and D and for the insulin response in K and L; ΔAUCs of the insulin response relative to that of glucose are shown in M and N. AUC0–30min and AUC0–120min, respectively, of the C-peptide response (calculated as change from 0 rather than as change from basal) is shown in G and H; C-peptide AUC0–30min and AUC0–120min/insulin ΔAUC are shown in O and P. Data for each individual dog are shown in C, D, G, H, and K–P with a horizontal line showing the median for the group; controls (CTR) are shown with open symbols and group treated with bromocriptine mesylate (Bromo) with filled symbols; n = 5 CTR and n = 6 Bromo. Responses that are marked with the same letter are not significantly different from one another, whereas those marked only with different letters differ significantly (P < 0.05).

