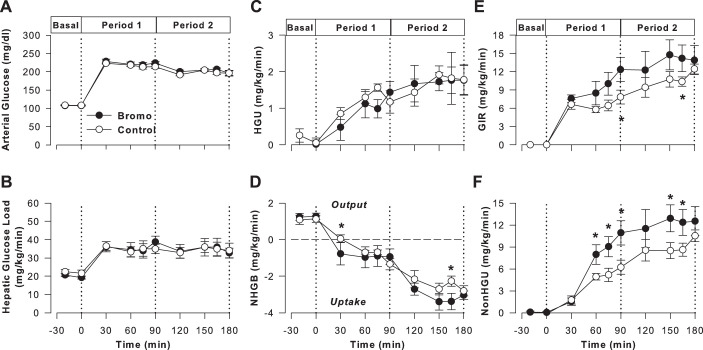
Fig. 2.
Clamp study data. Arterial plasma glucose (A), hepatic glucose load (HGL; B), hepatic glucose uptake (HGU; C), net hepatic glucose balance (NHGB; D), glucose infusion rate (GIR) (E), and nonhepatic glucose uptake (non-HGU; F) in controls (CTR; ○, open symbols; n = 5) and group treated with bromocriptine mesylate (Bromo; ●, filled symbols; n = 6) during the basal (−20 to 0 min) and experimental periods (0 to 180 min) of hyperinsulinemic hyperglycemic clamps. Data are means ± SE. *P < 0.05 between groups based on ANOVA; symbols mark results of post hoc analysis.

