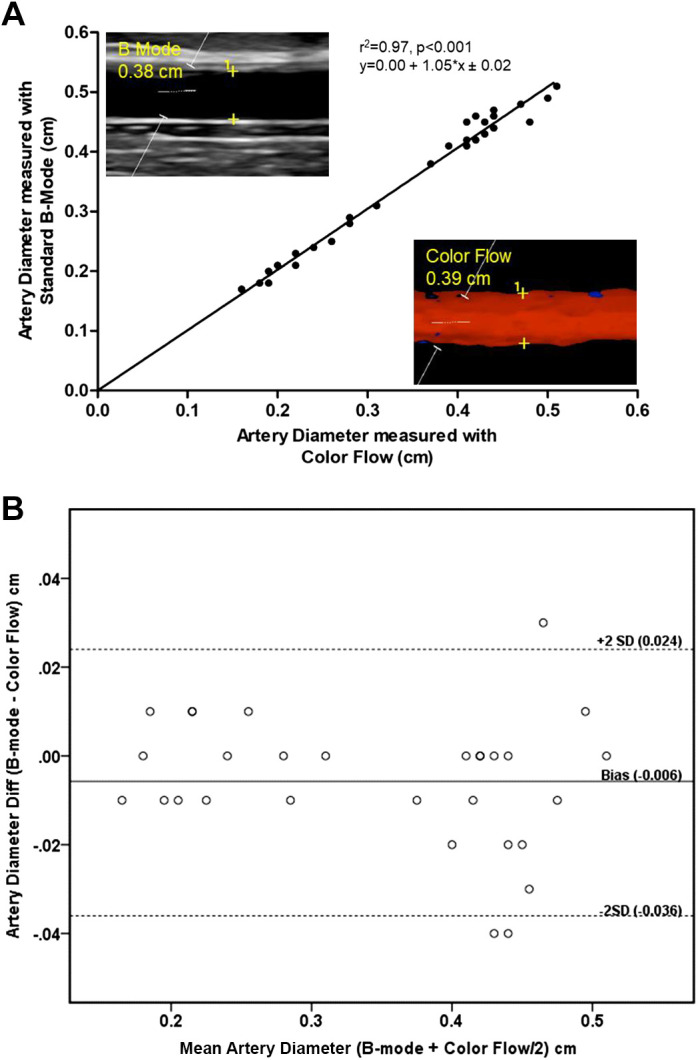
Fig. 1.

A comparison of peripheral vessel diameter determined by both color flow and B-mode ultrasound. A: linear regression between Standard B-mode and color flow measured diameters in the brachial and radial arteries (r2 = 0.97, P < 0.001). Inlaid, exemplar B-mode image illustrating the resolution of peripheral artery wall and a color flow image illustrating the assessment of wall diameter with color flow (without B-mode). B: Bland-Altman plot of vessel diameters performed with B-mode and color flow in the brachial and radial arteries. The y-axis indicates the difference between B-mode and color flow diameter, whereas the x-axis documents the average of their values. The bias represents the mean difference between the measurements, with values above zero indicating an overestimation and values below zero indicating an underestimation of B-mode relative to color flow diameter. Upper and lower lines represent bias ± 2 SD (n = 10).
