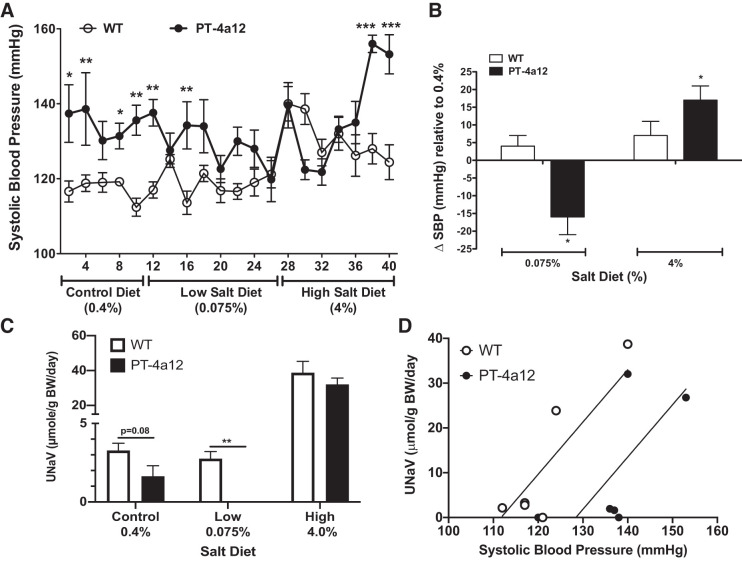
Fig. 5.
A: effects of low- and high-salt diets on systolic blood pressure in male PT-4a12 and wild-type (WT) mice. B: changes in systolic blood pressure (SBP) compared with control-salt diet. Results are means ± SE of the difference between the last day of low- or high-salt diet and the last day of control-salt diet. C: urinary sodium excretion (UNaV) on day 2 of each diet. Results are means ± SE; n = 5 mice/group. *P < 0.05, **P < 0.01, and ***P < 0.001 vs. WT mice (1-way ANOVA). D: pressure-natriuresis curve depicting average systolic blood pressure vs. average sodium excretion (n = 5 mice/group). BW, body weight.

