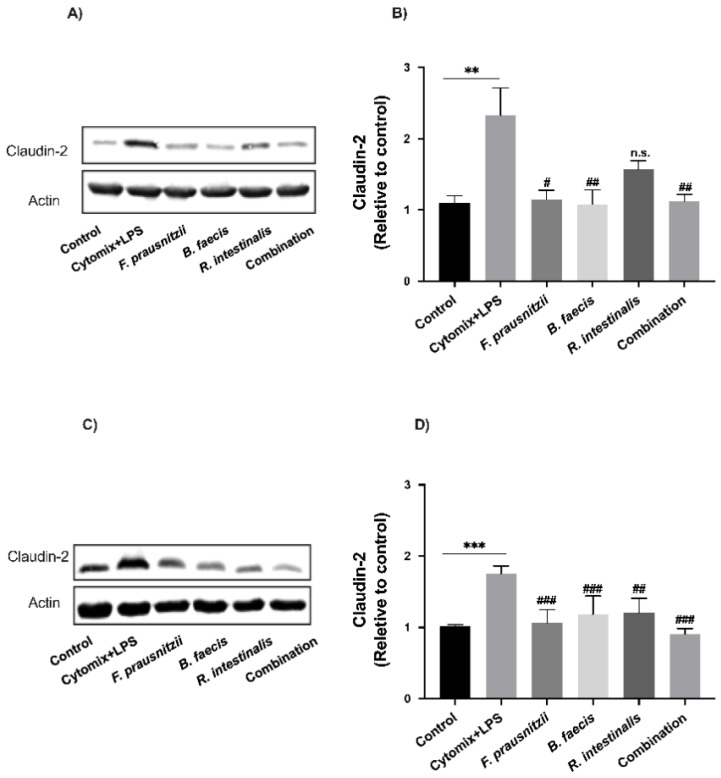
Figure 7.
Effect of F. prausnitzii, B. faecis and R. intestinalis alone and in combination on claudin-2 expression. Representative claudin-2 immunoblot and the relative densities of Caco-2 (A,B) and HT29-MTX cells (C,D). The protein bands were quantified through densitometry analysis and normalized to the intensity of the β-actin bands. Data were shown as the mean ± SD of the three biological replicates (n = 3). ** p ≤ 0.01 *** p ≤ 0.001 compared to the control group. # p ≤ 0.05, ## p ≤ 0.01, ### p ≤ 0.001, n.s., no significant compared to the cytomix + LPS group as determined by one-way ANOVA.

