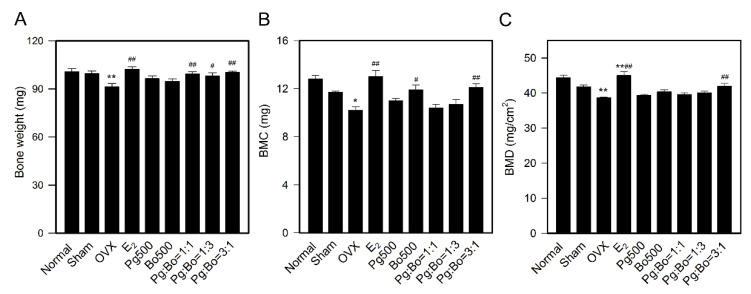
Figure 3.
Effect of Pg and Bo on bone weight and bone mineral density. (A) Bone weight was measured on the day of sacrifice (n = 10). Bone mineral content (BMC) (B) and bone mineral density (BMD) (C) of right femurs were measured using a DXA (n = 8). All values are expressed as mean ± SEM. * p < 0.05 and ** p < 0.01 compared with Sham, # p < 0.05 and ## p < 0.01 compared with OVX.

