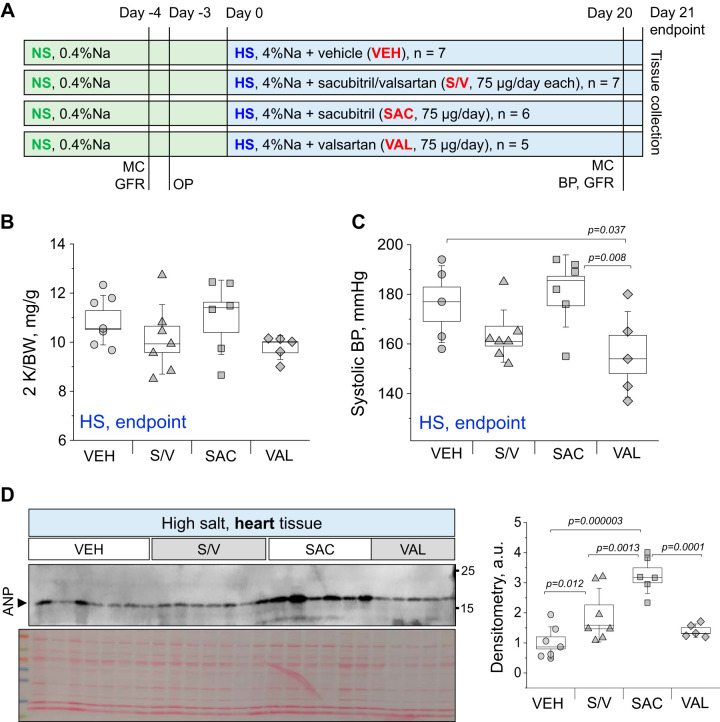
Fig. 1.
Experimental protocol and basic end-point parameters. A: schematic representation of the experimental protocol. NS, normal-salt diet; HS, high-salt diet; MC, metabolic cage collections; GFR, glomerular filtration rate measurements; BP, blood pressure measurement; OP, osmotic pump installation. B and C: end-point two kidney-to-total body weight ratio (2 K/BW; B) and systolic blood pressure value (C) in vehicle (VEH)-, sacubitril/valsartan (S/V)-, sacubitril (SAC)-, and valsartan (VAL)-treated groups. D: Western blot analysis showing atrial natriuretic peptide (ANP) expression in end point-collected heart tissues from VEH-, S/V-, SAC-, and VAL-treated groups. a.u., arbitrary units. Each point on the graphs denotes data obtained from one animal. One-way ANOVA with a Holm-Sidak test was used for significance comparisons. P values are shown for comparisons where P < 0.05.

