Fig. 6.
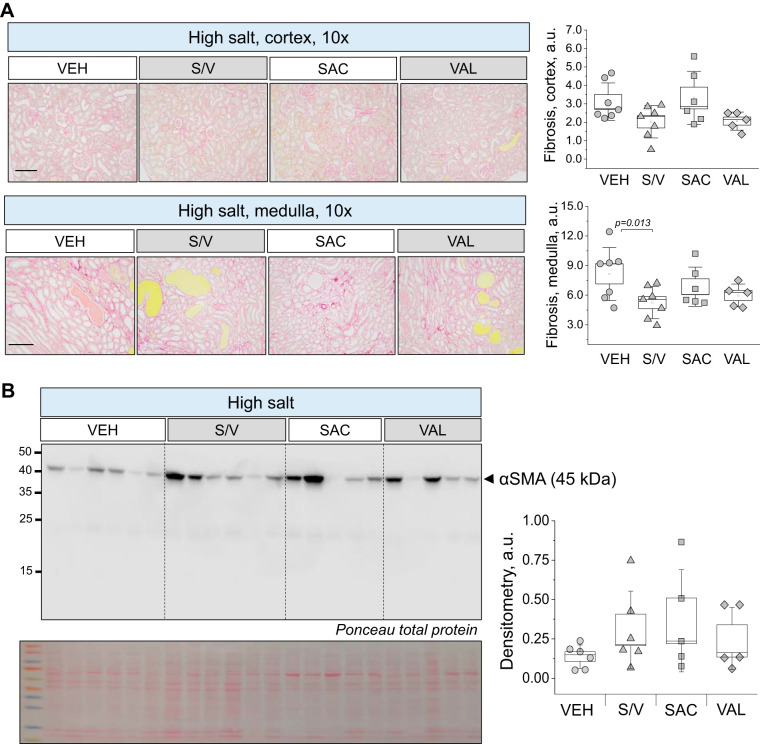
Renal fibrosis analysis in the experimental groups. A, left: representative images of renal tissues stained with picrosirius red. Shown are images of the cortex and medulla (×10, scale bar = 100 μm) obtained from rats at the end point of the experimental protocol [high-salt diet, upon administration of vehicle (VEH), sacubitril/valsartan (S/V), sacubitril alone (SAC), and valsartan alone (VAL)]. A, right: analysis of the staining. a.u., arbitrary units. B, left: expression of α-smooth muscle actin (α-SMA) measured in the renal cortex of the animals at the end point of the experimental protocol. Each lane on the Western blot represents a separate experimental animal. B, right: summaries of densitometry values. Total protein staining (Ponceau) is below the Western image. One-way ANOVA with a Holm-Sidak test was used for significance comparisons. P values are shown for comparisons where P < 0.05.

