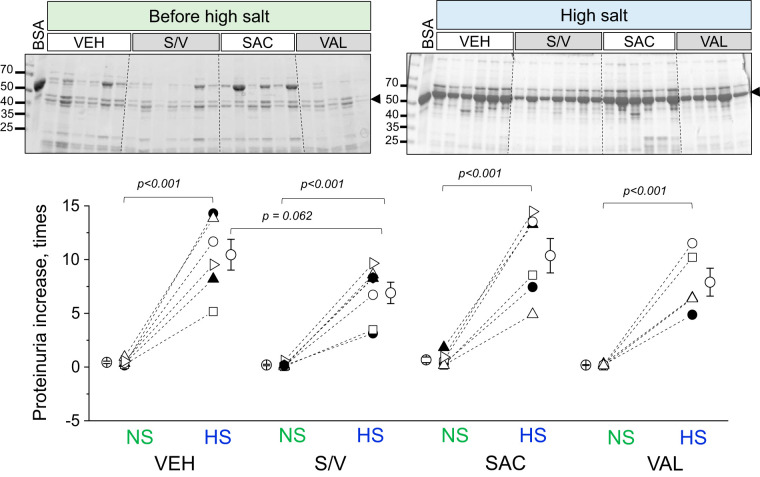
Fig. 7.
End-point quantification of proteinuria. Top: Western blots obtained from urinary samples collected from experimental animals before [normal-salt diet (NS)] and on day 20 after a switch to the high-salt diet (HS) and administration of vehicle (VEH), sacubitril/valsartan (S/V), sacubitril alone (SAC), and valsartan alone (VAL). BSA (5 μg) was used as a loading control (first lane). Bottom: quantification was performed by normalizing end-point proteinuria values (corrected for urine flow) to the starting point. Each point on the graphs denotes data obtained from one animal. One-way ANOVA with a Holm-Sidak post hoc test was used for significance comparisons among groups on the same salt diet. Paired data (before-after high-salt diet) was compared using a Student’s paired t test. P values are shown for comparisons where P < 0.05.

