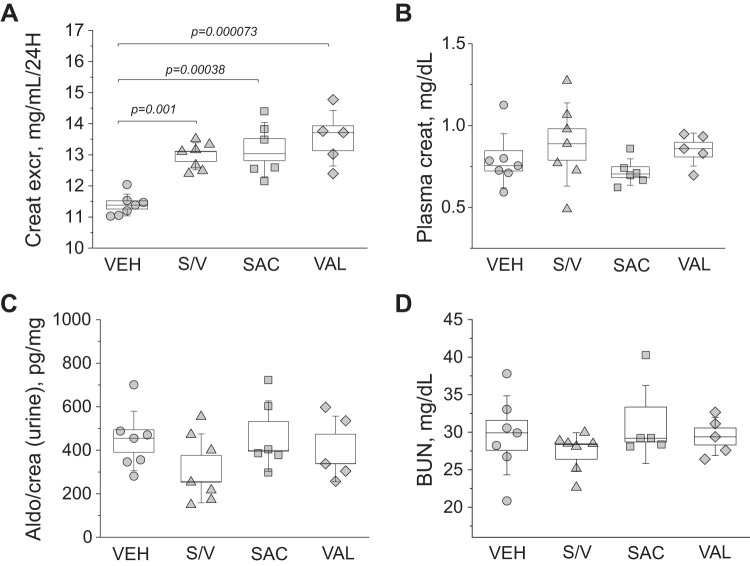
Fig. 8.
Plasma and urinary creatinine, aldosterone, and blood urea nitrogen (BUN) levels. A−D: creatinine excretion (Creat excr; A, normalized to urine flow), plasma creatinine (creat) level (B), aldosterone-to-creatinine ratio (Aldo/crea; C, in the urine), and BUN (D). All data were obtained at the end point of the experimental protocol. One-way ANOVA with a Holm-Sidak post hoc test was used for significance comparisons among groups. Each point on the graphs denotes data obtained from one animal. P values are shown for comparisons where P < 0.05.

