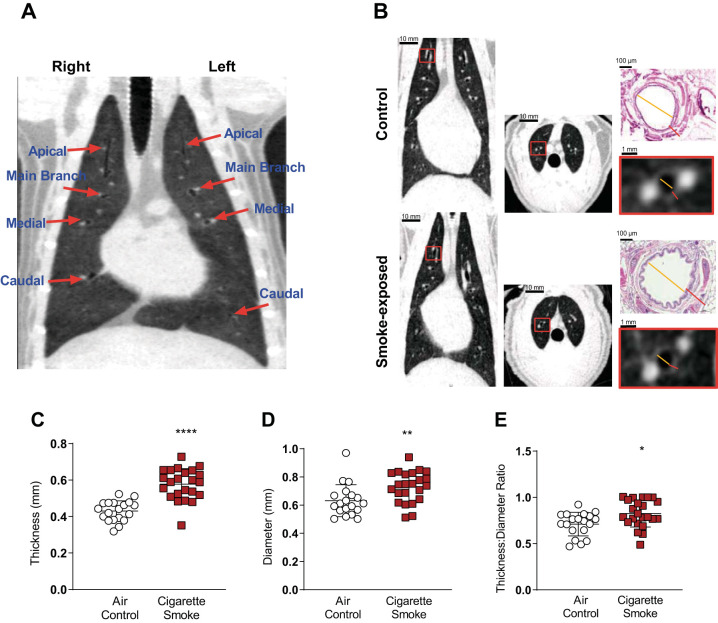
Fig. 1.
Structural analysis of smoke-exposed ferret airways using microcomputed tomography (µCT). A: representative image of ferret lung µCT scan. Red arrows show the locations where airway measurements were taken. B: representative coronal and axial projections of air control (top) and 6 mo smoke-exposed (bottom) ferrets. Lower insets are magnified views of a representative airway selected for measurements. Yellow line indicates airway luminal diameter (LD) and red line represents bronchial wall thickness (BWT). Upper insets demonstrate the same measurements by histopathological analysis for comparison. C: manual BWT of smoke-exposed and air control ferrets. Each point represents mean BWT of a single ferret derived from 6 airway measurements per ferret; n = 42 ferrets (23 smoke, 19 control). ****P < 0.0001. D: manual mean luminal diameter. **P < 0.01. E: manual mean ratio of BWT to LD. *P < 0.05. Inferential comparisons by Student’s t test.

