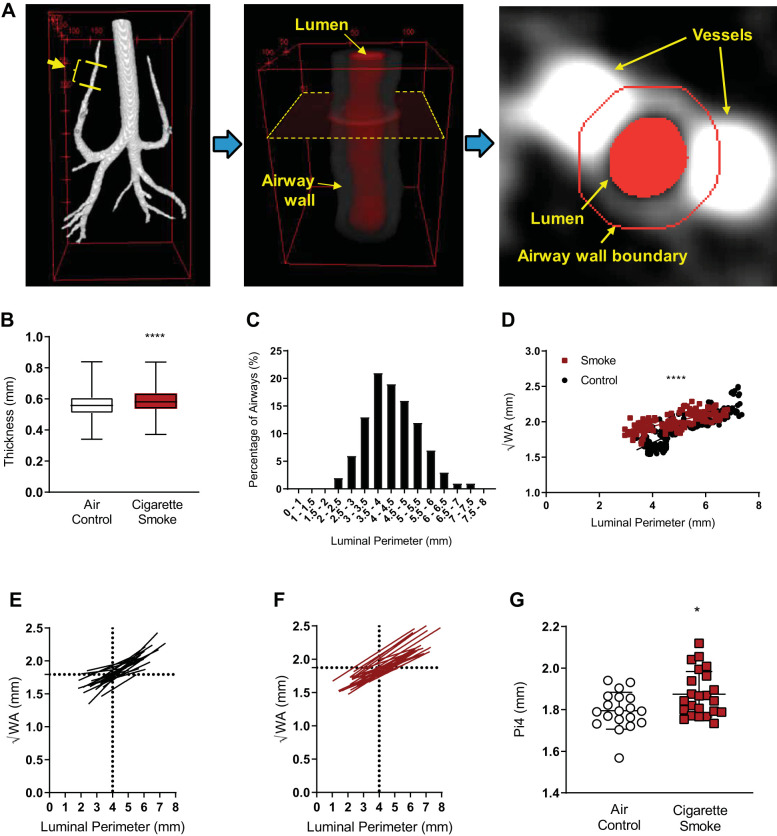
Fig. 4.
Semiautomated analysis of airway wall anatomy in smoke-exposed and air control ferrets. A: semiautomated image processing for measurement of bronchial wall thickness (BWT) is illustrated in 3 steps: first, the entire airway luminal region is segmented, and a target airway generation is specified as indicated with yellow lines. Second, the 3-dimensional computed tomography image is reoriented for the target airway region (lumen and wall) to be vertical to the image slices. A representative image slice is indicated with a dotted rectangle. Third, the bronchial wall boundary is automatically determined in each image slice. Typically, ~200 image slices were analyzed for each animal at one airway per apical lobe between the 4th and 6th generations. B: box plots of the semiautomated BWT in the control and smoke groups; n = 6,648 airways; ****P < 0.0001 by Student’s t test. Boxes denote the 25th–75th percentile and error bars represent the range. C: semiautomated probability density function of the luminal perimeter when the 4th–6th generations of the apical airway were analyzed in the control group. D: semiautomated scatter plots of calculated bronchial wall area (√WA) vs. airway luminal perimeter of a representative smoke-exposed and air control ferret, each plotted with a linear regression line. ****P < 0.0001. E and F: semiautomated linear regression lines of √WA vs. airway luminal perimeters of each ferret from the air control (E) and smoke-exposed (F) groups. Mean √WA at 4-mm luminal perimeter is indicated with dotted lines in each panel. G: semiautomated calculated √WA of the theoretical 4-mm perimeter airway (Pi4) for each ferret in the air control and smoke-exposed groups. *P = 0.012 by Student’s t test.

