Fig. 1.
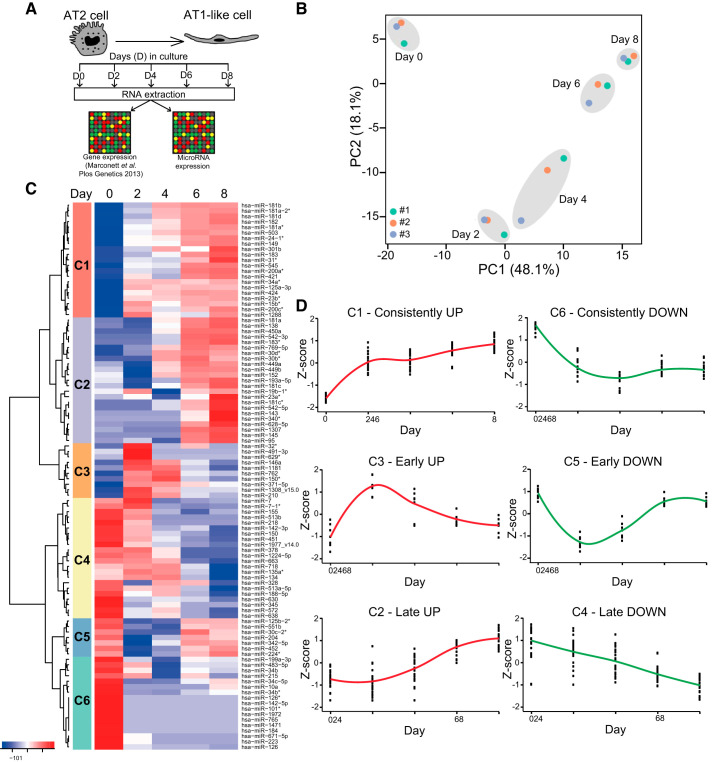
Genome-wide microRNA (miRNA) expression changes during AT2-to-AT1-like cell transdifferentiation. A: schematic of experimental design. Human AT2 (hAT2) cells were plated at day 0 (D0) and harvested at D0, 2, 4, 6, and 8 for RNA extraction and gene and miRNA expression analysis by microarray. B: principal component (PC) analysis of human alveolar epithelial cell samples from the miRNA microarray analysis following quality control and quantile normalization in R. #1, #2, and #3 indicate cells isolated from 3 different human donors (#1 = female, 61 yr old; #2 = female, 49 yr old; #3 = male, 47 yr old). C: cluster (C) analysis of the top 100 altered miRNAs based on z-score value. D: trend of miRNA expression over time for each cluster. Each dot represents a single miRNA. Lines are plotted along the means. Red, upregulated; green, downregulated.

