Fig. 2.
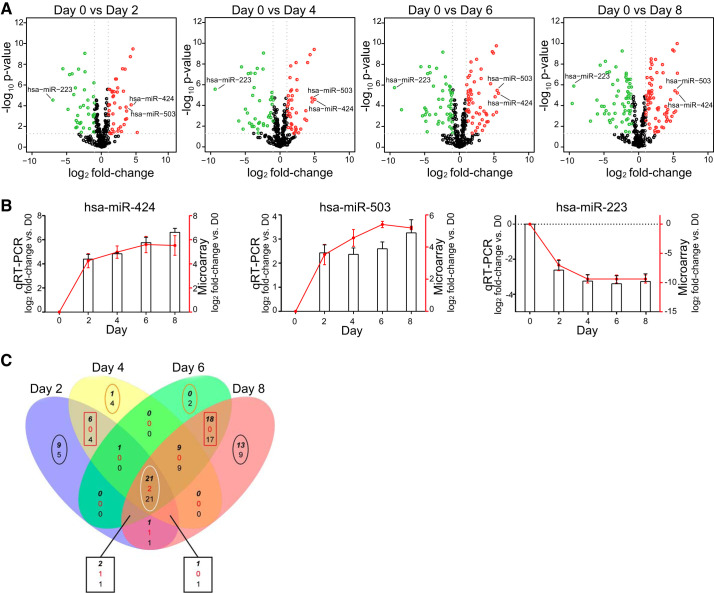
MicroRNAs (miRNAs) are differentially expressed during transdifferentiation. A: volcano plots showing significantly changing miRNAs over the course of alveolar epithelial cell (AEC) differentiation. Red dots are significantly upregulated; green dots are significantly downregulated. x-Axis shows log2 fold-change in miRNA expression; y-axis shows negative log10 of the Benjamini-Hochberg-corrected P values (−10logBH-pvalues). B: quantitative (q) RT-PCR and microarray quantification of 2 of the most upregulated (miR-424 and miR-503) and 1 of the most downregulated (miR-223) microRNAs. Columns, expression levels assessed by qRT-PCR; red line, expression level assessed by microarray; n = 3. Statistical analysis was performed with polynomial regression. hsa-mR-424: qRT-PCR P < 0.01; microarray P < 0.01. hsa-mR-503: qRT-PCR P < 0.05; microarray P < 0.01. hsa-mR-223: qRT-PCR P < 0.05; microarray P < 0.05. C: Venn diagram for microRNAs altered at day 2 (D2), D4, D6, and D8 compared with D0. At intersections (3 numbers): top bold italic number represents number of microRNAs with increased expression; middle red number indicates number of microRNAs with increased expression in 1 comparison and decreased expression in the other comparison; and bottom number indicates number of microRNAs that are decreased in expression. For miRNAs altered only at specific time points (uniquely altered), the top number indicates upregulated and bottom number downregulated. Black ovals, miRNAs uniquely altered at D2 and D8; orange oval, miRNAs uniquely altered at D4 and D6; red rectangles, miRNAs shared by D2 with D4, and D6 and D8; white oval, consistently altered microRNAs. One of the miRNAs upregulated at D2 (hsa-miR-886-3p_v15.0) and 1 of the consistently altered (hsa-miR-1977_v14.0) that were included in our analyses have since been withdrawn from miRBase.

