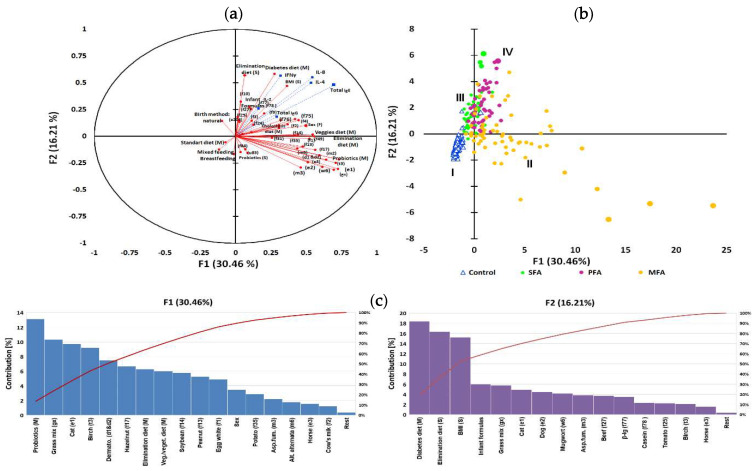
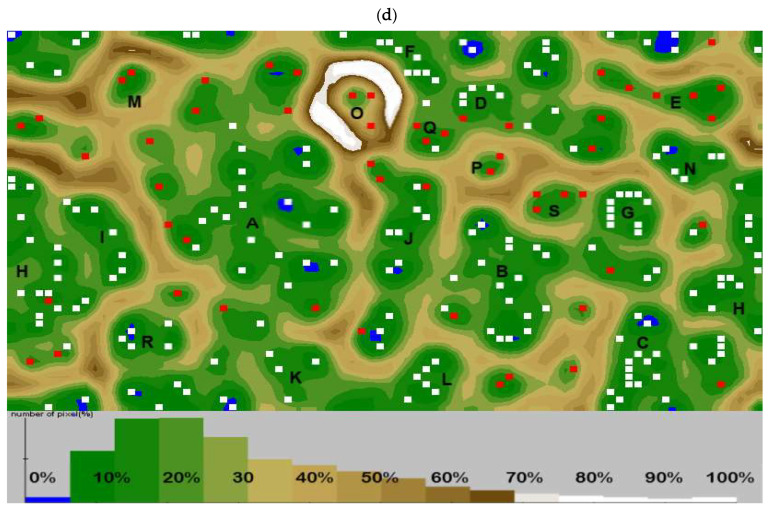
Figure 4.
IgE level as a grouping variable in allergy profile associated to gestational and early life dietary behaviour. The principal component analysis (PCA) results: (a) correlation circle presenting correlations between individual specific IgE antibodies profile and mothers gestational and subjects early life dietary behaviour (red circles) with other immunological parameters as an additional variable contribution (blue squares); (b) score plot: circles depict allergy groups: green—SFA, purple—PFA, yellow—MFA; triangles—control, numbers I—IV refer to clusters. Further characteristics of clusters are provided in the Table S8; (c) percentages of the contribution of the variables in major factors denoted as red line, contribution summing to 100%; (d) cluster analysis developed with an artificial neural network illustrating the specific IgE profile with superimposed levels of total E antibodies and mother’s gestational and subject’s early life dietary behaviour. Squares indicate one or several overlapping cases, and red squares indicate cases whose mothers declared who used gynaecological probiotics during pregnancy. Valleys (10–30%) gathered adjacent points most similar in terms of analysed features, while mountain chains (70–100%) separated the most diverse points (cases). Letters A–S letters refer to the significantly clustered 95% of the most similar cases in the cluster. Further characteristics of clusters are provided in the Table S9.


