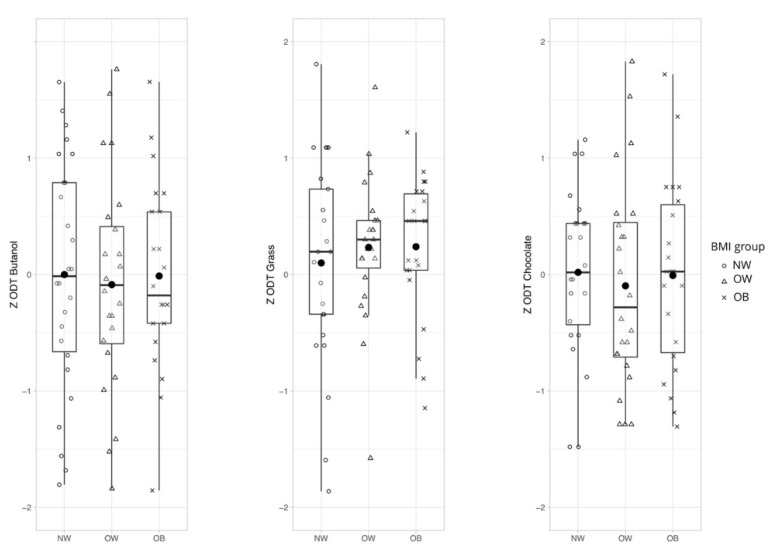
Figure 2.
Hypothesis 1: General odor sensitivity for chocolate, grass, and n-Butanol in different weight groups. No statistically significant difference between normal weight, overweight, and obese participants on odor thresholds after controlling for sex, F(2,138) = 0.004, p = 0.881. Abbreviations: NW—normal weight; OW—overweight; OB—obese; and ZODT—z-standardized score for odor thresholds.

