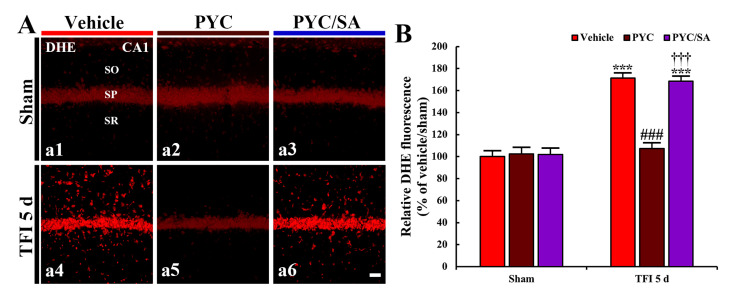
Figure 6.
(A) DHE fluorescence (a1–a6) in the CA1 area of the vehicle-treated (left column), PYC-treated (middle column) and PYC/sodium azide (SA)-treated (right column) group at 5 days after sham (upper panels) and TFI (lower panels). In the PYC/TFI group, DHE fluorescence intensity is significantly weaker than that in the vehicle/TFI group. However, in the PYC/SA/TFI group, DHE fluorescence intensity is similar to that in the vehicle/TFI group. Scale bar = 10 μm. (B) Quantitative analysis of DHE fluorescence intensity in CA1 pyramidal cells. The bars indicate the means ± SEM (n = 7/group; *** p < 0.001 vs. each sham group, ### p < 0.001 vs. corresponding vehicle-treated group, †††; p < 0.001 vs. corresponding PYC-treated group).

