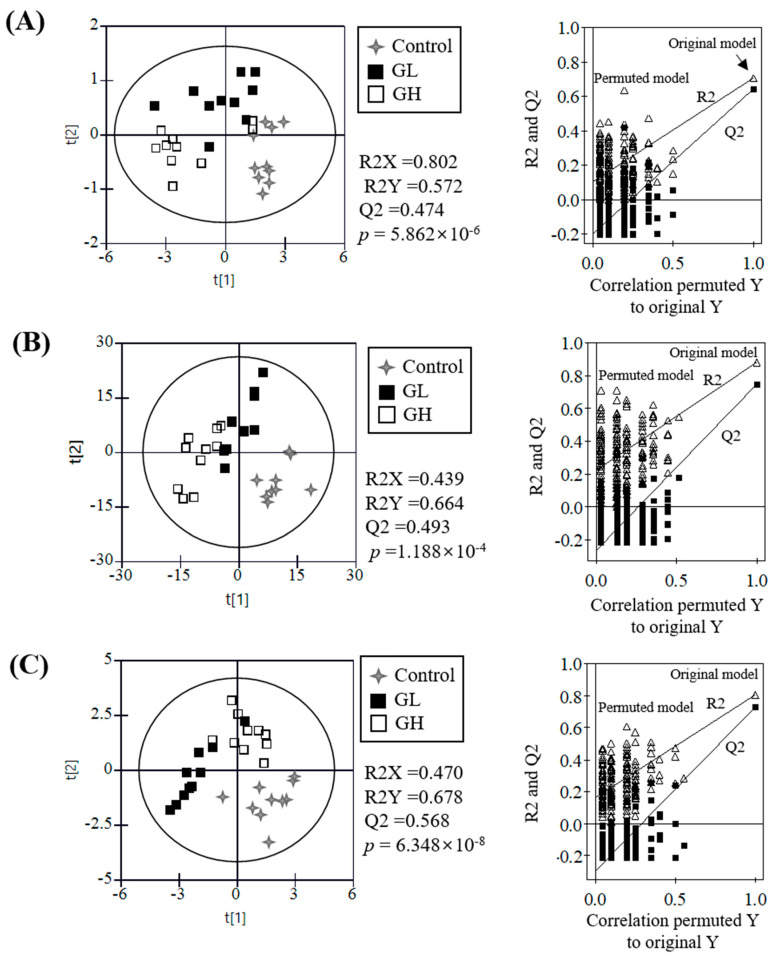
Figure 1.
Partial least-squares discriminant analysis (PLS-DA) score plots of plasma metabolites (A), kidney metabolites (B), and plasma and urine steroid hormones (C). The qualification of the PLS-DA models was evaluated by R2X, R2Y, Q2, and p-values and validated by cross validation with a permutation test (n = 200). R2X and R2Y showed the fitting quality of the models and Q2 showed their prediction quality. Cross validation was evaluated by intercepts of R2X and R2Y and their final values.

