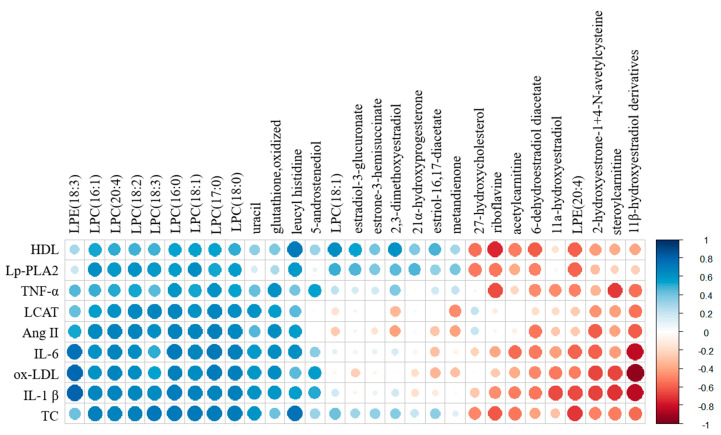
Figure 3.
Analysis of correlations between identified metabolites and steroid hormones and blood health-related factors. The correlation matrix was analyzed and visualized with a heat map generated with the R corrplot package. Positive correlations are shown in blue, and negative correlations are shown in red.

