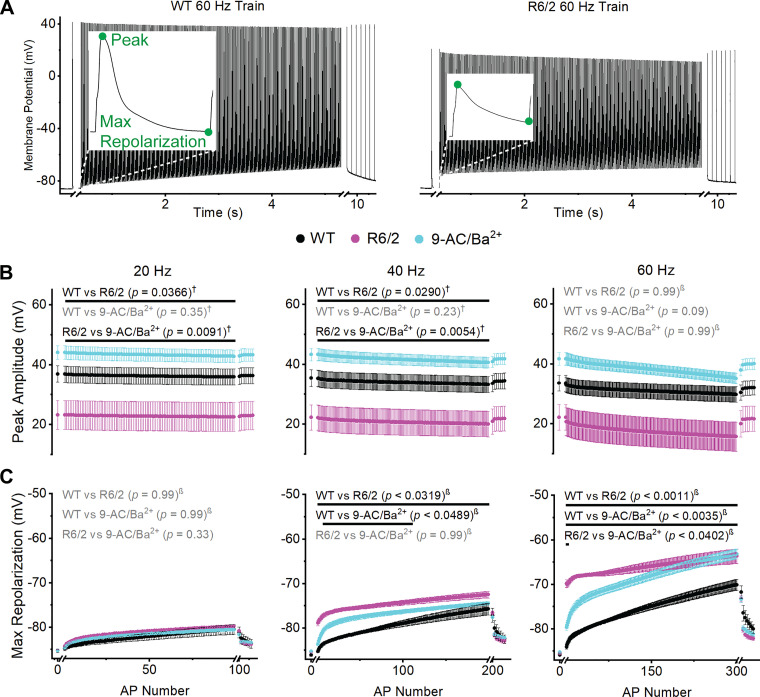
Fig. 3.
Action potential (AP) peak amplitude and maximum repolarization. A: representative wild-type (WT; left) and R6/2 (right) 60-Hz AP trains with peak amplitude and maximum repolarization labeled (insets). The x-axis breaks separate the 1st single AP and recovery APs from the train. B and C: graph of average peak amplitude (B) and maximum repolarization (C) at 20-Hz (left), 40-Hz (middle), and 60-Hz (right) for WT [n = 17 fibers (20 and 40 Hz) and 16 fibers (60 Hz) from 6 mice (3 males and 3 females)], R6/2 [n = 13 fibers (20 Hz), 11 fibers (40 Hz), and 12 fibers (60 Hz) from 4 mice (2 males and 2 females)], and 9-AC/Ba2+ [n = 16 fibers (20 Hz and 40 Hz) and 15 fibers (60 Hz) from 3 female mice]. Each AP is shown as an average ± SE. Black font signifies a significant difference and gray font indicates no significant difference between groups. Black lines indicate which APs were significantly different. † = Tukey’s comparison procedure. β=stepdown Bonferroni comparison procedure. No symbol = direct comparison.

