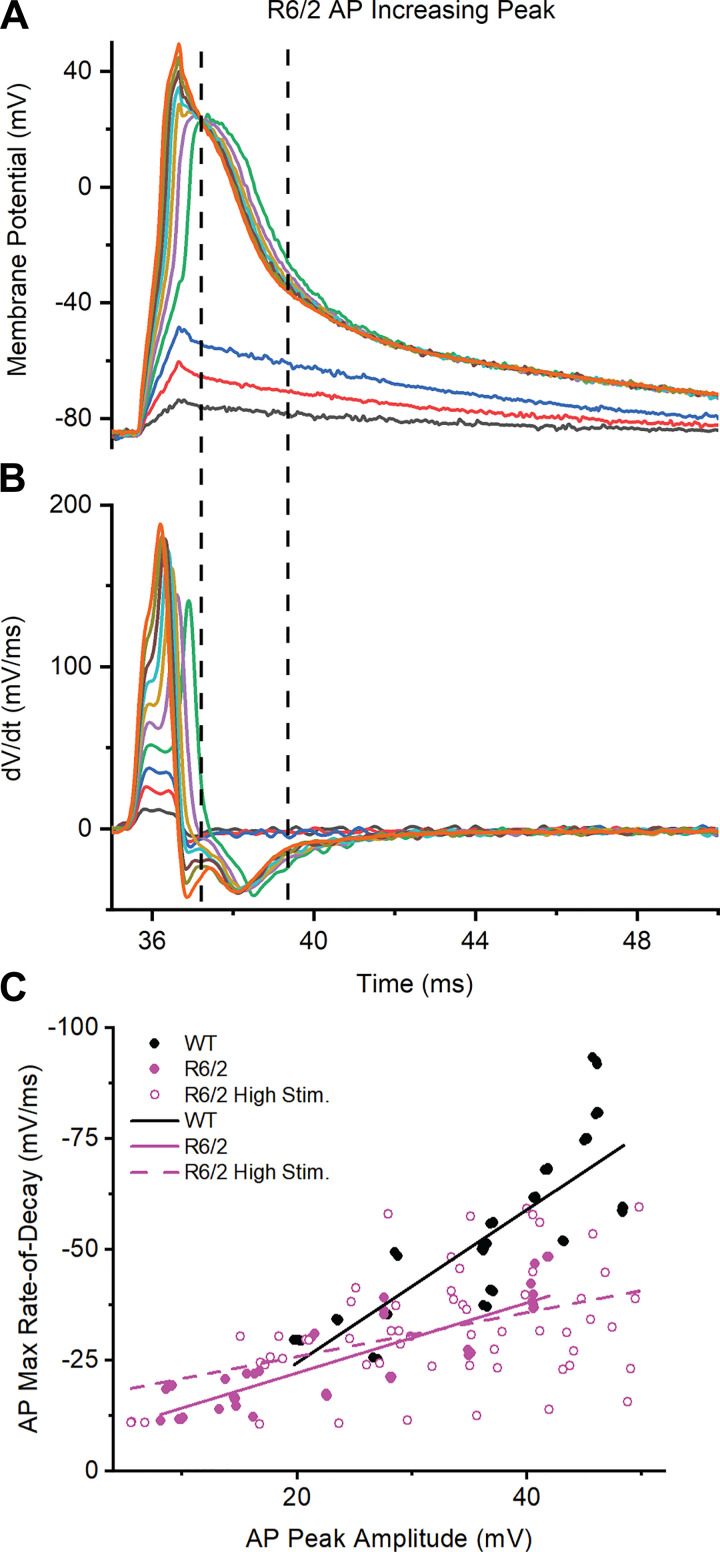
Fig. 6.
Relationship between action potential (AP) peak amplitude and maximum rate-of-decay. A: representative recording of R6/2 APs with increasing peak amplitudes. B: first derivative of the APs from A to determine maximum rate-of-decay. Traces in A and B are color-coded and the dotted lines bracket the region used for analysis. C: plot of AP maximum rate-of-decay vs. AP peak amplitude for wild-type [WT; n = 6 mice (3 males and 3 females), 17 fibers, 57 APs], R6/2 [n = 4 mice (2 males and 2 females), 13 fibers, 46 APs], and R6/2 high stimulation (high stim; n = 2 male mice, 11 fibers, 59 APs) with linear regression lines.

