Fig. 5.
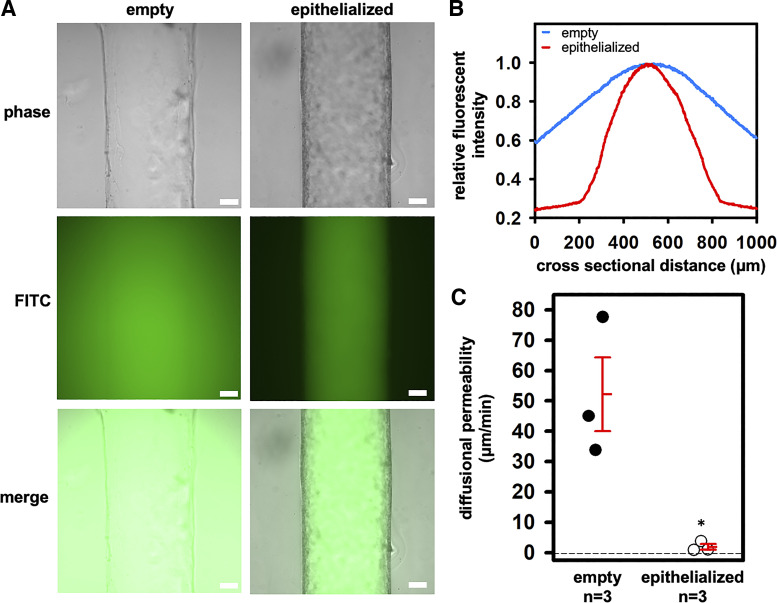
Epithelial integrity assessed with 3- to 5-kDa FITC-dextran over 1 h. A: representative phase-contrast and widefield fluorescent images. Scale bar = 100 μm. B: histogram of mean fluorescence across the channel cross section showing tight barrier function to perfused 3- to 5-kDa FITC-dextran over 1 h. C: the diffusional permeability of the FITC-dextran was lower in epithelialized versus empty channels. Individual data points as well as means ± SE are shown. *P = 0.01 versus “empty.”

